
|
نيس المحدودة (لطيفة) تقييم DCF |
Fully Editable: Tailor To Your Needs In Excel Or Sheets
Professional Design: Trusted, Industry-Standard Templates
Investor-Approved Valuation Models
MAC/PC Compatible, Fully Unlocked
No Expertise Is Needed; Easy To Follow
NICE Ltd. (NICE) Bundle
تبسيط التقييم NICE LTD. (لطيف) مع هذه الآلة الحاسبة DCF القابلة للتخصيص! يضم Real Nice Ltd. (لطيفة) البيانات المالية والمدخلات المتوقعة القابلة للتعديل ، يمكنك اختبار السيناريوهات وكشف Nice Ltd. (لطيفة) القيمة العادلة في دقائق.
What You Will Get
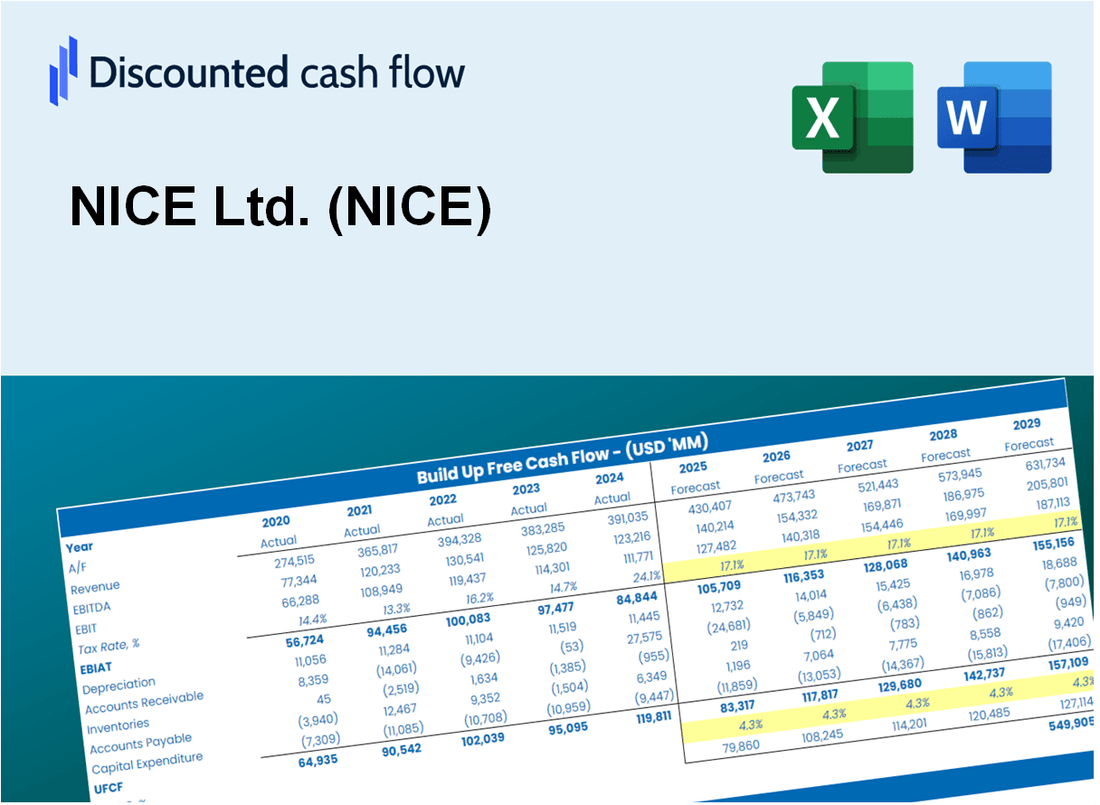
- Real NICE Data: Preloaded financials – from revenue to EBIT – based on actual and projected figures for NICE Ltd. (NICE).
- Full Customization: Adjust all critical parameters (yellow cells) such as WACC, growth %, and tax rates to fit your analysis.
- Instant Valuation Updates: Automatic recalculations to assess the impact of changes on NICE Ltd.'s (NICE) fair value.
- Versatile Excel Template: Designed for quick edits, scenario testing, and detailed projections specific to NICE Ltd. (NICE).
- Time-Saving and Accurate: Avoid the hassle of building models from scratch while ensuring precision and flexibility.
Key Features
- Comprehensive Data: NICE Ltd.'s historical financial reports and pre-populated forecasts.
- Customizable Parameters: Modify WACC, tax rates, revenue growth, and EBITDA margins as needed.
- Real-Time Insights: Observe NICE Ltd.'s intrinsic value recalculating instantly.
- Intuitive Visualizations: Dashboard graphs illustrate valuation outcomes and essential metrics.
- Designed for Precision: A professional resource for analysts, investors, and finance professionals.
How It Works
- 1. Access the Template: Download and open the Excel file containing NICE Ltd.'s (NICE) preloaded financial data.
- 2. Adjust Assumptions: Modify key parameters such as growth projections, WACC, and capital expenditures.
- 3. Review Results Instantly: The DCF model automatically computes intrinsic value and NPV in real-time.
- 4. Explore Scenarios: Evaluate various forecasts to assess different valuation possibilities.
- 5. Present with Assurance: Deliver expert valuation insights to back your strategic decisions.
Why Choose the NICE Ltd. (NICE) Calculator?
- Accuracy: Utilizes genuine NICE Ltd. financial data for precise calculations.
- Flexibility: Tailored for users to easily adjust and test various inputs.
- Time-Saving: Avoid the complexities of constructing a DCF model from the ground up.
- Professional-Grade: Crafted with the expertise and precision expected at the CFO level.
- User-Friendly: Intuitive design makes it accessible for users with limited financial modeling skills.
Who Should Use This Product?
- Professional Investors: Develop comprehensive and trustworthy valuation models for analyzing NICE Ltd. (NICE).
- Corporate Finance Teams: Evaluate valuation scenarios to inform strategic decisions within the organization.
- Consultants and Advisors: Deliver precise valuation insights to clients regarding NICE Ltd. (NICE).
- Students and Educators: Utilize real-world data to enhance learning and practice in financial modeling.
- Tech Enthusiasts: Gain insights into how technology companies like NICE Ltd. (NICE) are valued in the marketplace.
What the Template Contains
- Pre-Filled DCF Model: NICE Ltd.'s (NICE) financial data preloaded for immediate use.
- WACC Calculator: Detailed calculations for Weighted Average Cost of Capital.
- Financial Ratios: Evaluate NICE Ltd.'s (NICE) profitability, leverage, and efficiency.
- Editable Inputs: Change assumptions such as growth, margins, and CAPEX to fit your scenarios.
- Financial Statements: Annual and quarterly reports to support detailed analysis.
- Interactive Dashboard: Easily visualize key valuation metrics and results.
Disclaimer
All information, articles, and product details provided on this website are for general informational and educational purposes only. We do not claim any ownership over, nor do we intend to infringe upon, any trademarks, copyrights, logos, brand names, or other intellectual property mentioned or depicted on this site. Such intellectual property remains the property of its respective owners, and any references here are made solely for identification or informational purposes, without implying any affiliation, endorsement, or partnership.
We make no representations or warranties, express or implied, regarding the accuracy, completeness, or suitability of any content or products presented. Nothing on this website should be construed as legal, tax, investment, financial, medical, or other professional advice. In addition, no part of this site—including articles or product references—constitutes a solicitation, recommendation, endorsement, advertisement, or offer to buy or sell any securities, franchises, or other financial instruments, particularly in jurisdictions where such activity would be unlawful.
All content is of a general nature and may not address the specific circumstances of any individual or entity. It is not a substitute for professional advice or services. Any actions you take based on the information provided here are strictly at your own risk. You accept full responsibility for any decisions or outcomes arising from your use of this website and agree to release us from any liability in connection with your use of, or reliance upon, the content or products found herein.