
|
Pershing Square Holdings ، Ltd. (PSH.AS) DCF تقييم |
Fully Editable: Tailor To Your Needs In Excel Or Sheets
Professional Design: Trusted, Industry-Standard Templates
Investor-Approved Valuation Models
MAC/PC Compatible, Fully Unlocked
No Expertise Is Needed; Easy To Follow
Pershing Square Holdings, Ltd. (PSH.AS) Bundle
تبحث لتقييم القيمة الجوهرية لـ Pershing Square Holdings ، Ltd.؟ يدمج حاسبة DCF (PSHAS) DCF بيانات العالم الحقيقي مع خيارات تخصيص شاملة ، مما يتيح لك تحسين توقعاتك واتخاذ خيارات استثمار أكثر استنارة.
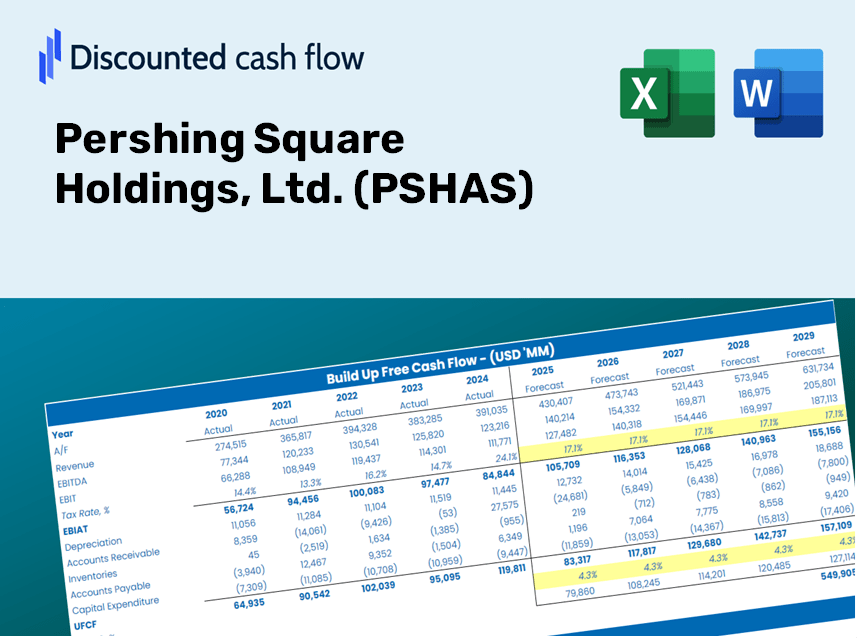
Discounted Cash Flow (DCF) - (USD MM)
| Year | AY1 2019 |
AY2 2020 |
AY3 2021 |
AY4 2022 |
AY5 2023 |
FY1 2024 |
FY2 2025 |
FY3 2026 |
FY4 2027 |
FY5 2028 |
|---|---|---|---|---|---|---|---|---|---|---|
| Revenue | 2,192.3 | 3,773.3 | 2,550.1 | -1,182.9 | 3,141.5 | 1,882.5 | 1,128.1 | 676.0 | 405.1 | 242.8 |
| Revenue Growth, % | 0 | 72.12 | -32.42 | -146.38 | -365.59 | -40.08 | -40.08 | -40.08 | -40.08 | -40.08 |
| EBITDA | .0 | .0 | 2,523.5 | -1,095.3 | .0 | 721.2 | 432.2 | 259.0 | 155.2 | 93.0 |
| EBITDA, % | 0 | 0 | 98.96 | 92.6 | 0 | 38.31 | 38.31 | 38.31 | 38.31 | 38.31 |
| Depreciation | -2,247.7 | -3,843.1 | -1.5 | 34.4 | -2,658.3 | -1,082.8 | -648.8 | -388.8 | -233.0 | -139.6 |
| Depreciation, % | -102.53 | -101.85 | -0.05841339 | -2.91 | -84.62 | -57.52 | -57.52 | -57.52 | -57.52 | -57.52 |
| EBIT | 2,247.7 | 3,843.1 | 2,525.0 | -1,129.6 | 2,658.3 | 1,804.0 | 1,081.0 | 647.8 | 388.2 | 232.6 |
| EBIT, % | 102.53 | 101.85 | 99.02 | 95.5 | 84.62 | 95.83 | 95.83 | 95.83 | 95.83 | 95.83 |
| Total Cash | 1,222.8 | 1,879.6 | 1,767.8 | 1,147.4 | 14,630.3 | 669.8 | 401.4 | 240.5 | 144.1 | 86.4 |
| Total Cash, percent | .0 | .0 | .0 | .0 | .0 | .0 | .0 | .0 | .0 | .0 |
| Account Receivables | 6.9 | 8.5 | 9.8 | 13.1 | 15.1 | 1.1 | .7 | .4 | .2 | .1 |
| Account Receivables, % | 0.31654 | 0.22397 | 0.38516 | -1.11 | 0.47967 | 0.05933732 | 0.05933732 | 0.05933732 | 0.05933732 | 0.05933732 |
| Inventories | -5,734.3 | -9,093.5 | -13,028.1 | -10,578.8 | .0 | -753.0 | -451.2 | -270.4 | -162.0 | -97.1 |
| Inventories, % | -261.57 | -240.99 | -510.88 | 894.34 | 0 | -40 | -40 | -40 | -40 | -40 |
| Accounts Payable | 45.5 | 1.5 | 464.5 | 6.2 | 321.0 | 113.0 | 67.7 | 40.6 | 24.3 | 14.6 |
| Accounts Payable, % | 2.08 | 0.03879787 | 18.21 | -0.52242 | 10.22 | 6 | 6 | 6 | 6 | 6 |
| Capital Expenditure | .0 | .0 | .0 | .0 | .0 | .0 | .0 | .0 | .0 | .0 |
| Capital Expenditure, % | 0 | 0 | 0 | 0 | 0 | 0 | 0 | 0 | 0 | 0 |
| Tax Rate, % | 2.58 | 2.58 | 2.58 | 2.58 | 2.58 | 2.58 | 2.58 | 2.58 | 2.58 | 2.58 |
| EBITAT | 2,161.5 | 3,651.1 | 2,437.7 | -1,104.6 | 2,589.7 | 1,742.3 | 1,044.1 | 625.7 | 374.9 | 224.7 |
| Depreciation | ||||||||||
| Changes in Account Receivables | ||||||||||
| Changes in Inventories | ||||||||||
| Changes in Accounts Payable | ||||||||||
| Capital Expenditure | ||||||||||
| UFCF | 5,686.7 | 3,121.6 | 6,832.6 | -3,981.1 | -10,334.5 | 1,218.6 | 48.6 | 29.1 | 17.5 | 10.5 |
| WACC, % | 6.78 | 6.77 | 6.78 | 6.79 | 6.79 | 6.78 | 6.78 | 6.78 | 6.78 | 6.78 |
| PV UFCF | ||||||||||
| SUM PV UFCF | 1,228.7 | |||||||||
| Long Term Growth Rate, % | 2.00 | |||||||||
| Free cash flow (T + 1) | 11 | |||||||||
| Terminal Value | 223 | |||||||||
| Present Terminal Value | 161 | |||||||||
| Enterprise Value | 1,390 | |||||||||
| Net Debt | -1,929 | |||||||||
| Equity Value | 3,319 | |||||||||
| Diluted Shares Outstanding, MM | 189 | |||||||||
| Equity Value Per Share | 17.58 |
ماذا ستتلقى
- بيانات مربع بيرشينج الأصلية: البيانات المالية الشاملة - من الإيرادات إلى صافي الدخل - باستخدام أرقام حقيقية ومتوقعة.
- التخصيص الكامل: تعديل جميع المعلمات الأساسية (الخلايا المميزة) مثل WACC و Growth ٪ ومعدلات الضرائب.
- تحديثات التقييم الفوري: عمليات إعادة المعالجة الآلية لتقييم تأثير التعديلات على القيمة العادلة لـ Pershing Square.
- قالب Excel المرن: تم تصميمه للتعديلات السهلة ، وتحليل السيناريو ، والتنبؤ المتعمق.
- كفاءة ودقيقة: التخلص من الحاجة إلى إنشاء نماذج من الألف إلى الياء مع ضمان الدقة والقدرة على التكيف.
الميزات الرئيسية
- 🔍 PSHAS Financial في الحياة الواقعية: البيانات التاريخية والمتوقعة المليئة مسبقًا بـ Pershing Square Holdings ، Ltd.
- ✏️ مدخلات قابلة للتخصيص بالكامل: تعديل جميع المعلمات الأساسية (الخلايا الصفراء) مثل WACC و Growth ٪ ومعدلات الضرائب.
- 📊 تقييم DCF المهني: تقوم الصيغ المتكاملة بتقييم القيمة الجوهرية لـ Pershing Square باستخدام طريقة التدفق النقدي المخفض.
- ⚡ النتائج الفورية: تصور تقييم ميدان pershing فور إجراء التعديلات.
- تحليل السيناريو: تقييم ومقارنة نتائج الافتراضات المالية المختلفة بتنسيق جنبًا إلى جنب.
كيف تعمل
- الخطوة 1: قم بتنزيل جدول بيانات Excel.
- الخطوة 2: فحص بيانات Pershing Square Holdings المليئة مسبقًا (تاريخية ومتوقعة).
- الخطوة 3: تعديل الافتراضات الرئيسية (المبرمة باللون الأصفر) وفقا لتحليلك.
- الخطوة 4: راقب عمليات إعادة الحساب التلقائية لقيمة Pershing Square Holdings الجوهرية.
- الخطوة 5: الاستفادة من نتائج قرارات الاستثمار أو أغراض الإبلاغ.
لماذا حدد هذه الآلة الحاسبة لـ Pershing Square Holdings ، Ltd. (PSHAS)؟
- حل الكل في واحد: تقدم تحليلات DCF و WACC ونسبة النسبة المالية متكاملة بسلاسة.
- تكوينات مرنة: تعديل الحقول ذات الضوء الصفراء لاستكشاف سيناريوهات الاستثمار المختلفة.
- تحليل متعمق: يحسب تلقائيًا القيمة الجوهرية والقيمة الحالية الصافية لـ PSHAS.
- بيانات تم تكوينها مسبقًا: يتضمن البيانات التاريخية والمتوقعة للتقييمات الأساسية الدقيقة.
- ميزات على مستوى الخبراء: مثالي للمحللين الماليين والمستثمرين ومستشاري الأعمال.
من يجب أن يستفيد من هذا المنتج؟
- المستثمرون: تقييم تقييم Pershing Square Holdings ، Ltd. (PSHAS) قبل قرارات التداول.
- الماليين والمحللين الماليين: تحسين سير عمل التقييم وتقييم التوقعات المالية.
- مؤسسو الشركات الناشئة: فهم طرق التقييم المطبقة على شركات مهمة مثل Pershing Square Holdings.
- الاستشاريون: قم بإنشاء تقارير تقييم مفصلة لعملائك باستخدام رؤى الصناعة.
- الطلاب والمعلمين: دمج البيانات في الوقت الفعلي لتعلم وتعليم منهجيات التقييم.
مكونات القالب متضمنة
- نموذج DCF المليء مسبقًا: البيانات المالية لـ Pershing Square Holdings ، Ltd. (PSHAS) تم تحميلها مسبقًا للتطبيق الفوري.
- حاسبة WACC: حسابات شاملة لمتوسط تكلفة رأس المال المصمم خصيصًا (PSHAS).
- النسب المالية: تحليل المقاييس الربحية والرافعة المالية والكفاءة لـ Pershing Square Holdings ، Ltd. (PSHAS).
- مدخلات قابلة للتحرير: اضبط الافتراضات مثل معدلات النمو وهامش الربح و Capex لتناسب تحليلك.
- البيانات المالية: الوصول إلى التقارير السنوية والفصلية لتسهيل التقييم المتعمق.
- لوحة القيادة التفاعلية: تصور دون عناء مقاييس ونتائج التقييم الأساسية.
Disclaimer
All information, articles, and product details provided on this website are for general informational and educational purposes only. We do not claim any ownership over, nor do we intend to infringe upon, any trademarks, copyrights, logos, brand names, or other intellectual property mentioned or depicted on this site. Such intellectual property remains the property of its respective owners, and any references here are made solely for identification or informational purposes, without implying any affiliation, endorsement, or partnership.
We make no representations or warranties, express or implied, regarding the accuracy, completeness, or suitability of any content or products presented. Nothing on this website should be construed as legal, tax, investment, financial, medical, or other professional advice. In addition, no part of this site—including articles or product references—constitutes a solicitation, recommendation, endorsement, advertisement, or offer to buy or sell any securities, franchises, or other financial instruments, particularly in jurisdictions where such activity would be unlawful.
All content is of a general nature and may not address the specific circumstances of any individual or entity. It is not a substitute for professional advice or services. Any actions you take based on the information provided here are strictly at your own risk. You accept full responsibility for any decisions or outcomes arising from your use of this website and agree to release us from any liability in connection with your use of, or reliance upon, the content or products found herein.