
|
Pershing Square Holdings, Ltd. (PSH.As) Évaluation DCF |
Entièrement Modifiable: Adapté À Vos Besoins Dans Excel Ou Sheets
Conception Professionnelle: Modèles Fiables Et Conformes Aux Normes Du Secteur
Pré-Construits Pour Une Utilisation Rapide Et Efficace
Compatible MAC/PC, entièrement débloqué
Aucune Expertise N'Est Requise; Facile À Suivre
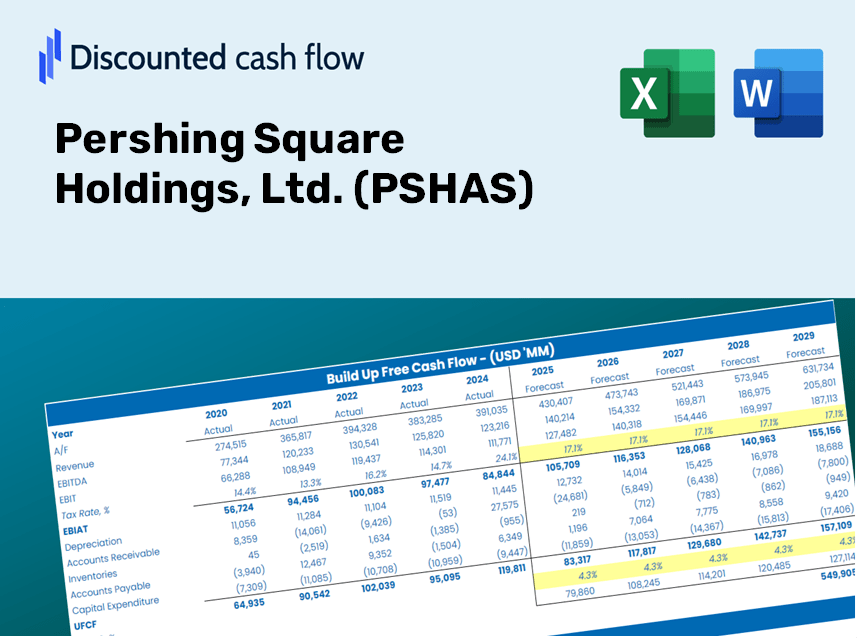
Pershing Square Holdings, Ltd. (PSH.AS) Bundle
Vous cherchez à évaluer la valeur intrinsèque de Pershing Square Holdings, Ltd.? Notre calculatrice (PSHAS) DCF intègre des données réelles avec des options de personnalisation complètes, vous permettant d'affiner vos prévisions et de faire des choix d'investissement plus éclairés.
Discounted Cash Flow (DCF) - (USD MM)
| Year | AY1 2019 |
AY2 2020 |
AY3 2021 |
AY4 2022 |
AY5 2023 |
FY1 2024 |
FY2 2025 |
FY3 2026 |
FY4 2027 |
FY5 2028 |
|---|---|---|---|---|---|---|---|---|---|---|
| Revenue | 2,192.3 | 3,773.3 | 2,550.1 | -1,182.9 | 3,141.5 | 1,882.5 | 1,128.1 | 676.0 | 405.1 | 242.8 |
| Revenue Growth, % | 0 | 72.12 | -32.42 | -146.38 | -365.59 | -40.08 | -40.08 | -40.08 | -40.08 | -40.08 |
| EBITDA | .0 | .0 | 2,523.5 | -1,095.3 | .0 | 721.2 | 432.2 | 259.0 | 155.2 | 93.0 |
| EBITDA, % | 0 | 0 | 98.96 | 92.6 | 0 | 38.31 | 38.31 | 38.31 | 38.31 | 38.31 |
| Depreciation | -2,247.7 | -3,843.1 | -1.5 | 34.4 | -2,658.3 | -1,082.8 | -648.8 | -388.8 | -233.0 | -139.6 |
| Depreciation, % | -102.53 | -101.85 | -0.05841339 | -2.91 | -84.62 | -57.52 | -57.52 | -57.52 | -57.52 | -57.52 |
| EBIT | 2,247.7 | 3,843.1 | 2,525.0 | -1,129.6 | 2,658.3 | 1,804.0 | 1,081.0 | 647.8 | 388.2 | 232.6 |
| EBIT, % | 102.53 | 101.85 | 99.02 | 95.5 | 84.62 | 95.83 | 95.83 | 95.83 | 95.83 | 95.83 |
| Total Cash | 1,222.8 | 1,879.6 | 1,767.8 | 1,147.4 | 14,630.3 | 669.8 | 401.4 | 240.5 | 144.1 | 86.4 |
| Total Cash, percent | .0 | .0 | .0 | .0 | .0 | .0 | .0 | .0 | .0 | .0 |
| Account Receivables | 6.9 | 8.5 | 9.8 | 13.1 | 15.1 | 1.1 | .7 | .4 | .2 | .1 |
| Account Receivables, % | 0.31654 | 0.22397 | 0.38516 | -1.11 | 0.47967 | 0.05933732 | 0.05933732 | 0.05933732 | 0.05933732 | 0.05933732 |
| Inventories | -5,734.3 | -9,093.5 | -13,028.1 | -10,578.8 | .0 | -753.0 | -451.2 | -270.4 | -162.0 | -97.1 |
| Inventories, % | -261.57 | -240.99 | -510.88 | 894.34 | 0 | -40 | -40 | -40 | -40 | -40 |
| Accounts Payable | 45.5 | 1.5 | 464.5 | 6.2 | 321.0 | 113.0 | 67.7 | 40.6 | 24.3 | 14.6 |
| Accounts Payable, % | 2.08 | 0.03879787 | 18.21 | -0.52242 | 10.22 | 6 | 6 | 6 | 6 | 6 |
| Capital Expenditure | .0 | .0 | .0 | .0 | .0 | .0 | .0 | .0 | .0 | .0 |
| Capital Expenditure, % | 0 | 0 | 0 | 0 | 0 | 0 | 0 | 0 | 0 | 0 |
| Tax Rate, % | 2.58 | 2.58 | 2.58 | 2.58 | 2.58 | 2.58 | 2.58 | 2.58 | 2.58 | 2.58 |
| EBITAT | 2,161.5 | 3,651.1 | 2,437.7 | -1,104.6 | 2,589.7 | 1,742.3 | 1,044.1 | 625.7 | 374.9 | 224.7 |
| Depreciation | ||||||||||
| Changes in Account Receivables | ||||||||||
| Changes in Inventories | ||||||||||
| Changes in Accounts Payable | ||||||||||
| Capital Expenditure | ||||||||||
| UFCF | 5,686.7 | 3,121.6 | 6,832.6 | -3,981.1 | -10,334.5 | 1,218.6 | 48.6 | 29.1 | 17.5 | 10.5 |
| WACC, % | 6.78 | 6.77 | 6.78 | 6.79 | 6.79 | 6.78 | 6.78 | 6.78 | 6.78 | 6.78 |
| PV UFCF | ||||||||||
| SUM PV UFCF | 1,228.7 | |||||||||
| Long Term Growth Rate, % | 2.00 | |||||||||
| Free cash flow (T + 1) | 11 | |||||||||
| Terminal Value | 223 | |||||||||
| Present Terminal Value | 161 | |||||||||
| Enterprise Value | 1,390 | |||||||||
| Net Debt | -1,929 | |||||||||
| Equity Value | 3,319 | |||||||||
| Diluted Shares Outstanding, MM | 189 | |||||||||
| Equity Value Per Share | 17.58 |
What You Will Receive
- Genuine Pershing Square Data: Comprehensive financials – from revenue to net income – utilizing real and projected numbers.
- Complete Customization: Modify all essential parameters (highlighted cells) such as WACC, growth %, and tax rates.
- Instant Valuation Updates: Automated recalibrations to assess the effect of adjustments on Pershing Square's fair value.
- Flexible Excel Template: Designed for easy modifications, scenario analysis, and in-depth forecasting.
- Efficient and Precise: Eliminate the need to create models from the ground up while ensuring accuracy and adaptability.
Key Features
- 🔍 Real-Life PSHAS Financials: Pre-filled historical and projected data for Pershing Square Holdings, Ltd.
- ✏️ Fully Customizable Inputs: Modify all essential parameters (yellow cells) such as WACC, growth %, and tax rates.
- 📊 Professional DCF Valuation: Integrated formulas assess Pershing Square’s intrinsic value utilizing the Discounted Cash Flow method.
- ⚡ Instant Results: Visualize the valuation of Pershing Square immediately after adjustments are made.
- Scenario Analysis: Evaluate and compare outcomes for different financial assumptions in a side-by-side format.
How It Functions
- Step 1: Download the Excel spreadsheet.
- Step 2: Examine the pre-filled Pershing Square Holdings data (historical and projected).
- Step 3: Modify key assumptions (highlighted in yellow) according to your analysis.
- Step 4: Observe the automatic recalculations for Pershing Square Holdings’ intrinsic value.
- Step 5: Utilize the results for investment decisions or reporting purposes.
Why Select This Calculator for Pershing Square Holdings, Ltd. (PSHAS)?
- All-in-One Solution: Offers DCF, WACC, and financial ratio analyses seamlessly integrated.
- Flexible Configurations: Modify the yellow-highlighted fields to explore different investment scenarios.
- In-Depth Analysis: Automatically computes the intrinsic value and Net Present Value of PSHAS.
- Pre-Configured Data: Includes historical and projected data for precise baseline evaluations.
- Expert-Level Features: Perfect for financial analysts, investors, and business advisors.
Who Should Benefit from This Product?
- Investors: Assess Pershing Square Holdings, Ltd. (PSHAS) valuation prior to trading decisions.
- CFOs and Financial Analysts: Optimize valuation workflows and evaluate financial forecasts.
- Startup Founders: Understand the valuation methods applied to significant firms like Pershing Square Holdings.
- Consultants: Create detailed valuation reports for your clients utilizing industry insights.
- Students and Educators: Incorporate real-time data to learn and teach valuation methodologies.
Included Components of the Template
- Pre-Filled DCF Model: Financial data for Pershing Square Holdings, Ltd. (PSHAS) preloaded for immediate application.
- WACC Calculator: Comprehensive calculations for the Weighted Average Cost of Capital tailored to (PSHAS).
- Financial Ratios: Analyze profitability, leverage, and efficiency metrics for Pershing Square Holdings, Ltd. (PSHAS).
- Editable Inputs: Adjust assumptions such as growth rates, profit margins, and CAPEX to suit your analysis.
- Financial Statements: Access to annual and quarterly reports to facilitate in-depth evaluation.
- Interactive Dashboard: Effortlessly visualize essential valuation metrics and outcomes.
Disclaimer
All information, articles, and product details provided on this website are for general informational and educational purposes only. We do not claim any ownership over, nor do we intend to infringe upon, any trademarks, copyrights, logos, brand names, or other intellectual property mentioned or depicted on this site. Such intellectual property remains the property of its respective owners, and any references here are made solely for identification or informational purposes, without implying any affiliation, endorsement, or partnership.
We make no representations or warranties, express or implied, regarding the accuracy, completeness, or suitability of any content or products presented. Nothing on this website should be construed as legal, tax, investment, financial, medical, or other professional advice. In addition, no part of this site—including articles or product references—constitutes a solicitation, recommendation, endorsement, advertisement, or offer to buy or sell any securities, franchises, or other financial instruments, particularly in jurisdictions where such activity would be unlawful.
All content is of a general nature and may not address the specific circumstances of any individual or entity. It is not a substitute for professional advice or services. Any actions you take based on the information provided here are strictly at your own risk. You accept full responsibility for any decisions or outcomes arising from your use of this website and agree to release us from any liability in connection with your use of, or reliance upon, the content or products found herein.