
|
شركة Thermo Fisher Scientific Inc. (TMO) DCF تقييم |
Fully Editable: Tailor To Your Needs In Excel Or Sheets
Professional Design: Trusted, Industry-Standard Templates
Investor-Approved Valuation Models
MAC/PC Compatible, Fully Unlocked
No Expertise Is Needed; Easy To Follow
Thermo Fisher Scientific Inc. (TMO) Bundle
تقييم الآفاق المالية لشركة Thermo Fisher Scientific Inc. (TMO) مثل خبير! توفر لك حاسبة DCF (TMO) هذه المالية المملوءة مسبقًا مع السماح لك بالحرية في تعديل نمو الإيرادات ، WACC ، الهوامش ، وغيرها من الافتراضات الأساسية التي تتماشى مع تنبؤاتك.
What You Will Get
- Comprehensive TMO Financials: Access to historical and projected data for precise valuation.
- Customizable Inputs: Adjust WACC, tax rates, revenue growth, and capital expenditures as needed.
- Instant Calculations: Intrinsic value and NPV are dynamically computed for your convenience.
- Scenario Analysis: Evaluate various scenarios to assess Thermo Fisher's future performance.
- User-Friendly Design: Crafted for professionals while remaining approachable for newcomers.
Key Features
- Comprehensive DCF Calculator: Features detailed unlevered and levered DCF valuation models tailored for Thermo Fisher Scientific Inc. (TMO).
- WACC Calculator: Pre-designed Weighted Average Cost of Capital sheet with adjustable inputs specific to the needs of Thermo Fisher.
- Customizable Forecast Assumptions: Adjust growth rates, capital expenditures, and discount rates to fit Thermo Fisher's financial outlook.
- Integrated Financial Ratios: Evaluate profitability, leverage, and efficiency ratios relevant to Thermo Fisher Scientific Inc. (TMO).
- Interactive Dashboard and Charts: Visual representations summarize essential valuation metrics for straightforward analysis.
How It Works
- Step 1: Download the Excel file.
- Step 2: Review Thermo Fisher Scientific's pre-filled financial data and forecasts.
- Step 3: Modify key inputs such as revenue growth, WACC, and tax rates (highlighted cells).
- Step 4: Observe the DCF model update in real-time as you adjust your assumptions.
- Step 5: Analyze the outputs and utilize the results for your investment decisions.
Why Choose This Calculator for Thermo Fisher Scientific Inc. (TMO)?
- Precision: Utilizes accurate financial data from Thermo Fisher to ensure reliability.
- Adaptability: Crafted to allow users to easily adjust and experiment with inputs.
- Efficiency: Eliminate the need to create a DCF model from the ground up.
- Expert-Level: Designed with the expertise and usability expected by CFOs.
- Intuitive: Simple to navigate, making it accessible for users without deep financial modeling skills.
Who Should Use This Product?
- Life Science Researchers: Utilize advanced tools to analyze experimental data and enhance research outcomes.
- Healthcare Professionals: Integrate cutting-edge technologies into clinical practices for improved patient care.
- Pharmaceutical Companies: Streamline drug development processes and optimize research strategies with real-time analytics.
- Laboratory Technicians: Enhance laboratory efficiency with customizable workflows and automated solutions.
- Academic Institutions: Incorporate innovative methodologies into teaching and research programs.
What the Template Contains
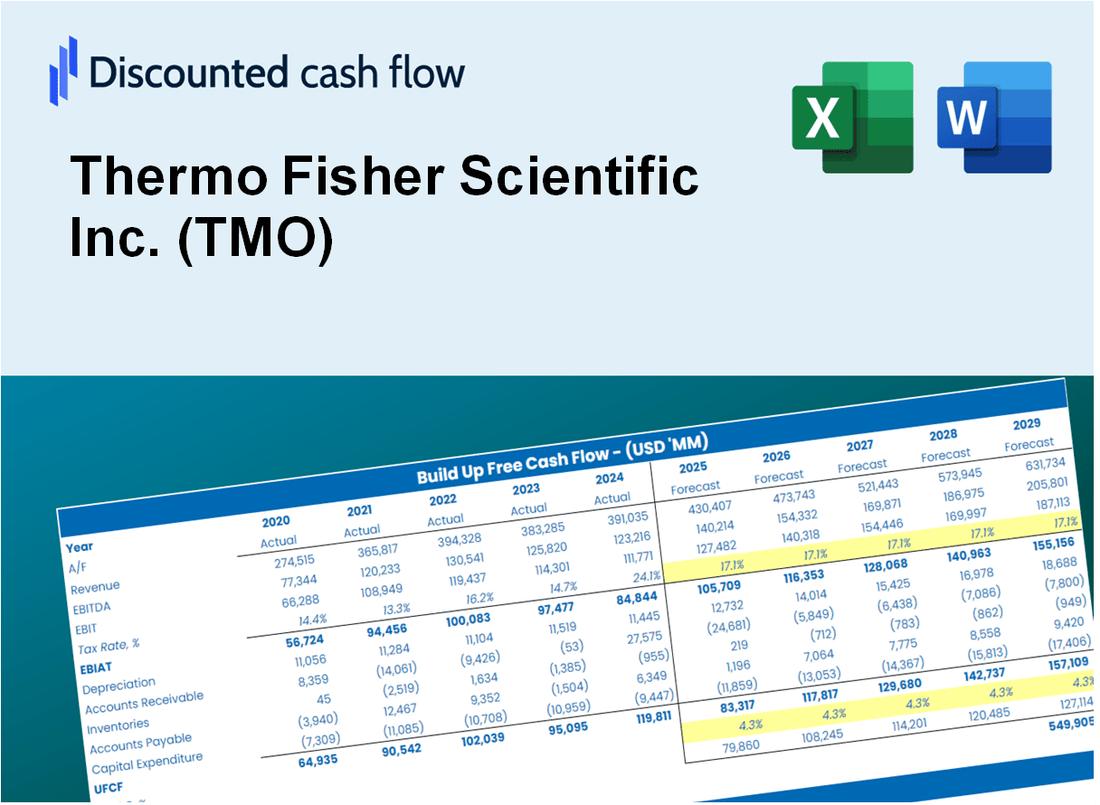
- Preloaded TMO Data: Historical and projected financial data, including revenue, EBIT, and capital expenditures.
- DCF and WACC Models: Professional-grade sheets for calculating intrinsic value and Weighted Average Cost of Capital.
- Editable Inputs: Yellow-highlighted cells for adjusting revenue growth, tax rates, and discount rates.
- Financial Statements: Comprehensive annual and quarterly financials for deeper analysis.
- Key Ratios: Profitability, leverage, and efficiency ratios to evaluate performance.
- Dashboard and Charts: Visual summaries of valuation outcomes and assumptions.
Disclaimer
All information, articles, and product details provided on this website are for general informational and educational purposes only. We do not claim any ownership over, nor do we intend to infringe upon, any trademarks, copyrights, logos, brand names, or other intellectual property mentioned or depicted on this site. Such intellectual property remains the property of its respective owners, and any references here are made solely for identification or informational purposes, without implying any affiliation, endorsement, or partnership.
We make no representations or warranties, express or implied, regarding the accuracy, completeness, or suitability of any content or products presented. Nothing on this website should be construed as legal, tax, investment, financial, medical, or other professional advice. In addition, no part of this site—including articles or product references—constitutes a solicitation, recommendation, endorsement, advertisement, or offer to buy or sell any securities, franchises, or other financial instruments, particularly in jurisdictions where such activity would be unlawful.
All content is of a general nature and may not address the specific circumstances of any individual or entity. It is not a substitute for professional advice or services. Any actions you take based on the information provided here are strictly at your own risk. You accept full responsibility for any decisions or outcomes arising from your use of this website and agree to release us from any liability in connection with your use of, or reliance upon, the content or products found herein.