
|
Travis Perkins PLC (TPK.L) DCF تقييم |
Fully Editable: Tailor To Your Needs In Excel Or Sheets
Professional Design: Trusted, Industry-Standard Templates
Investor-Approved Valuation Models
MAC/PC Compatible, Fully Unlocked
No Expertise Is Needed; Easy To Follow
Travis Perkins plc (TPK.L) Bundle
تقييم التوقعات المالية Travis Perkins PLC (TPKL) بدقة الخبراء! توفر لك حاسبة DCF (TPKL) هذه البيانات المالية المملوءة مسبقًا والقدرة على تعديل نمو الإيرادات و WACC والهوامش وغيرها من الافتراضات الأساسية التي تتماشى مع توقعاتك.
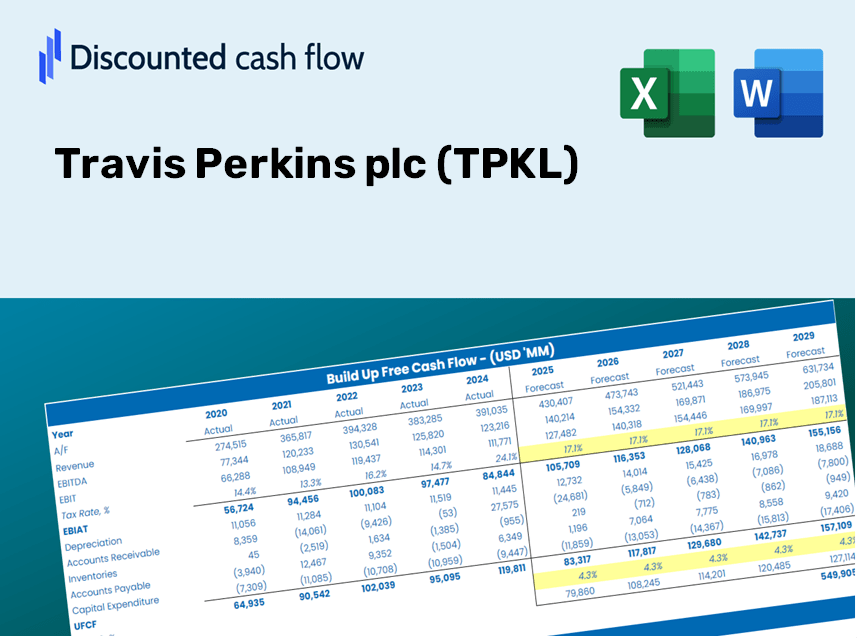
Discounted Cash Flow (DCF) - (USD MM)
| Year | AY1 2020 |
AY2 2021 |
AY3 2022 |
AY4 2023 |
AY5 2024 |
FY1 2025 |
FY2 2026 |
FY3 2027 |
FY4 2028 |
FY5 2029 |
|---|---|---|---|---|---|---|---|---|---|---|
| Revenue | 3,697.5 | 4,586.7 | 4,994.8 | 4,861.9 | 4,607.4 | 4,895.9 | 5,202.6 | 5,528.4 | 5,874.6 | 6,242.5 |
| Revenue Growth, % | 0 | 24.05 | 8.9 | -2.66 | -5.23 | 6.26 | 6.26 | 6.26 | 6.26 | 6.26 |
| EBITDA | 193.7 | 464.9 | 461.2 | 303.2 | 202.7 | 345.1 | 366.7 | 389.7 | 414.1 | 440.0 |
| EBITDA, % | 5.24 | 10.14 | 9.23 | 6.24 | 4.4 | 7.05 | 7.05 | 7.05 | 7.05 | 7.05 |
| Depreciation | 158.1 | 170.0 | 169.6 | 183.1 | 190.6 | 188.8 | 200.6 | 213.2 | 226.5 | 240.7 |
| Depreciation, % | 4.28 | 3.71 | 3.4 | 3.77 | 4.14 | 3.86 | 3.86 | 3.86 | 3.86 | 3.86 |
| EBIT | 35.6 | 294.9 | 291.6 | 120.1 | 12.1 | 156.3 | 166.1 | 176.5 | 187.6 | 199.3 |
| EBIT, % | 0.96281 | 6.43 | 5.84 | 2.47 | 0.26262 | 3.19 | 3.19 | 3.19 | 3.19 | 3.19 |
| Total Cash | 505.6 | 459.8 | 235.7 | 131.5 | 244.4 | 356.7 | 379.0 | 402.8 | 428.0 | 454.8 |
| Total Cash, percent | .0 | .0 | .0 | .0 | .0 | .0 | .0 | .0 | .0 | .0 |
| Account Receivables | 892.7 | .0 | .0 | 689.6 | 760.5 | 536.9 | 570.5 | 606.3 | 644.2 | 684.6 |
| Account Receivables, % | 24.14 | 0 | 0 | 14.18 | 16.51 | 10.97 | 10.97 | 10.97 | 10.97 | 10.97 |
| Inventories | 840.7 | .0 | .0 | 727.6 | 648.6 | 507.0 | 538.8 | 572.5 | 608.4 | 646.5 |
| Inventories, % | 22.74 | 0 | 0 | 14.97 | 14.08 | 10.36 | 10.36 | 10.36 | 10.36 | 10.36 |
| Accounts Payable | 892.7 | 642.0 | 600.6 | 576.3 | 532.9 | 720.5 | 765.7 | 813.6 | 864.6 | 918.7 |
| Accounts Payable, % | 24.14 | 14 | 12.02 | 11.85 | 11.57 | 14.72 | 14.72 | 14.72 | 14.72 | 14.72 |
| Capital Expenditure | -102.3 | -164.7 | -139.1 | -131.1 | -72.2 | -131.3 | -139.5 | -148.2 | -157.5 | -167.4 |
| Capital Expenditure, % | -2.77 | -3.59 | -2.78 | -2.7 | -1.57 | -2.68 | -2.68 | -2.68 | -2.68 | -2.68 |
| Tax Rate, % | -101.56 | -101.56 | -101.56 | -101.56 | -101.56 | -101.56 | -101.56 | -101.56 | -101.56 | -101.56 |
| EBITAT | 39.1 | 269.1 | 228.8 | 65.4 | 24.4 | 132.6 | 140.9 | 149.7 | 159.1 | 169.1 |
| Depreciation | ||||||||||
| Changes in Account Receivables | ||||||||||
| Changes in Inventories | ||||||||||
| Changes in Accounts Payable | ||||||||||
| Capital Expenditure | ||||||||||
| UFCF | -745.8 | 1,757.1 | 217.9 | -1,324.1 | 107.5 | 742.9 | 181.8 | 193.2 | 205.3 | 218.1 |
| WACC, % | 7.45 | 7.26 | 6.99 | 6.46 | 7.45 | 7.12 | 7.12 | 7.12 | 7.12 | 7.12 |
| PV UFCF | ||||||||||
| SUM PV UFCF | 1,319.5 | |||||||||
| Long Term Growth Rate, % | 3.00 | |||||||||
| Free cash flow (T + 1) | 225 | |||||||||
| Terminal Value | 5,448 | |||||||||
| Present Terminal Value | 3,862 | |||||||||
| Enterprise Value | 5,181 | |||||||||
| Net Debt | 845 | |||||||||
| Equity Value | 4,336 | |||||||||
| Diluted Shares Outstanding, MM | 211 | |||||||||
| Equity Value Per Share | 2,053.94 |
ماذا ستتلقى
- نموذج مالي شامل: تتيح البيانات الفعلية لـ Travis Perkins PLC (TPKL) تقييمات دقيقة DCF.
- السيطرة الكاملة على التنبؤات: تعديل نمو الإيرادات ، هوامش الربح ، WACC ، وغيرها من المعلمات الأساسية.
- الحسابات في الوقت الحقيقي: توفر التحديثات التلقائية ملاحظات فورية أثناء ضبط المدخلات الخاصة بك.
- قالب من الدرجة المهنية: ملف Excel المصنوع بخبرة مثالية لعروض المستثمرين.
- مرنة وقابلة لإعادة الاستخدام: مصمم للتكيف ، تسهيل الاستخدام المتكرر للتنبؤ المتعمق.
الميزات الرئيسية
- 🔍 واقع TPKL Financial: البيانات التاريخية والمتوقعة المليئة مسبقًا بـ Travis Perkins PLC (TPKL).
- ✏️ مدخلات قابلة للتخصيص بالكامل: اضبط جميع المعلمات الأساسية (الخلايا الصفراء) مثل WACC و Growth ٪ ومعدلات الضرائب.
- 📊 تقييم DCF المهني: الصيغ المتكاملة حساب القيمة الجوهرية لـ Travis Perkins باستخدام طريقة التدفق النقدي المخفض.
- ⚡ النتائج الفورية: تصور تقييم TPKL فور إجراء التعديلات.
- تحليل السيناريو: استكشاف ومقارنة النتائج لمختلف الافتراضات المالية جنبًا إلى جنب.
كيف تعمل
- الخطوة 1: قم بتنزيل جدول بيانات Excel.
- الخطوة 2: فحص بيانات Travis Perkins PLC (TPKL) المليئة مسبقًا (التاريخية والمتوقعة).
- الخطوة 3: تعديل الافتراضات الرئيسية (المميزة باللون الأصفر) بناءً على تقييمك.
- الخطوة 4: راقب عمليات إعادة حساب الأوتوماتيكية للقيمة الجوهرية لـ Travis Perkins PLC (TPKL).
- الخطوة 5: الاستفادة من نتائج خيارات الاستثمار الخاصة بك أو متطلبات الإبلاغ.
لماذا تختار هذه الآلة الحاسبة؟
- واجهة سهلة الاستخدام: صُنعت لكل من المبتدئين والمهنيين المتمرسين.
- المعلمات القابلة للتخصيص: بسهولة ضبط المدخلات لتخصيص تحليلك.
- تحديثات الوقت الحقيقي: لاحظ التغييرات الفورية في تقييم Travis Perkins PLC (TPKL) أثناء تعديل المدخلات.
- تم تكوينه مسبقًا للراحة: يأتي مسبقًا مع البيانات المالية الفعلية من Travis Perkins PLC لتحليل SWIFT.
- يعتمد عليه خبراء الصناعة: يستخدمه المستثمرون والمحللين لاتخاذ قرارات مستنيرة.
من يجب أن يستخدم هذا المنتج؟
- المستثمرون: تقييم بدقة القيمة العادلة لـ Travis Perkins PLC (TPKL) قبل اتخاذ خيارات الاستثمار.
- المدير المالي: الاستفادة من نموذج DCF من الدرجة المهنية لتقارير وتحليل مالي شامل.
- الاستشاريون: تخصيص القالب بفعالية لتقارير تقييم العميل.
- رواد الأعمال: اكتساب رؤى حول ممارسات النمذجة المالية للشركات الرائدة.
- المعلمون: توظيفها كمورد تعليمي لتوضيح تقنيات التقييم.
محتويات القالب
- نموذج DCF المتعمق: قالب قابل للتخصيص يتضمن حسابات تقييم شاملة.
- البيانات المالية الحالية: Travis Perkins PLC's (TPKL) التاريخية والمواصفة المالية المسبقة للتحليل الشامل.
- المتغيرات القابلة للتعديل: تعديل WACC ومعدلات النمو والافتراضات الضريبية لاستكشاف سيناريوهات مختلفة.
- بيانات مالية كاملة: انهيار سنوي وفصلي مفصل للتفاصيل المحسنة.
- النسب الأساسية: تحليل متكامل للربحية والكفاءة والرافعة المالية.
- لوحة القيادة التفاعلية مع التصورات: المخططات والجداول التي تقدم نتائج واضحة وقابلة للتنفيذ.
Disclaimer
All information, articles, and product details provided on this website are for general informational and educational purposes only. We do not claim any ownership over, nor do we intend to infringe upon, any trademarks, copyrights, logos, brand names, or other intellectual property mentioned or depicted on this site. Such intellectual property remains the property of its respective owners, and any references here are made solely for identification or informational purposes, without implying any affiliation, endorsement, or partnership.
We make no representations or warranties, express or implied, regarding the accuracy, completeness, or suitability of any content or products presented. Nothing on this website should be construed as legal, tax, investment, financial, medical, or other professional advice. In addition, no part of this site—including articles or product references—constitutes a solicitation, recommendation, endorsement, advertisement, or offer to buy or sell any securities, franchises, or other financial instruments, particularly in jurisdictions where such activity would be unlawful.
All content is of a general nature and may not address the specific circumstances of any individual or entity. It is not a substitute for professional advice or services. Any actions you take based on the information provided here are strictly at your own risk. You accept full responsibility for any decisions or outcomes arising from your use of this website and agree to release us from any liability in connection with your use of, or reliance upon, the content or products found herein.