
|
Vivos Therapeutics ، Inc. (VVOS) DCF تقييم |
Fully Editable: Tailor To Your Needs In Excel Or Sheets
Professional Design: Trusted, Industry-Standard Templates
Investor-Approved Valuation Models
MAC/PC Compatible, Fully Unlocked
No Expertise Is Needed; Easy To Follow
Vivos Therapeutics, Inc. (VVOS) Bundle
هل تبحث عن تقييم القيمة الجوهرية لشركة Vivos Therapeutics، Inc. ؟ تدمج حاسبة VVOS DCF الخاصة بنا بيانات العالم الحقيقي مع ميزات التخصيص الشاملة، مما يسمح لك بتحسين توقعاتك وتعزيز خيارات الاستثمار الخاصة بك.
What You Will Get
- Editable Excel Template: A fully customizable Excel-based DCF Calculator featuring pre-filled real VVOS financials.
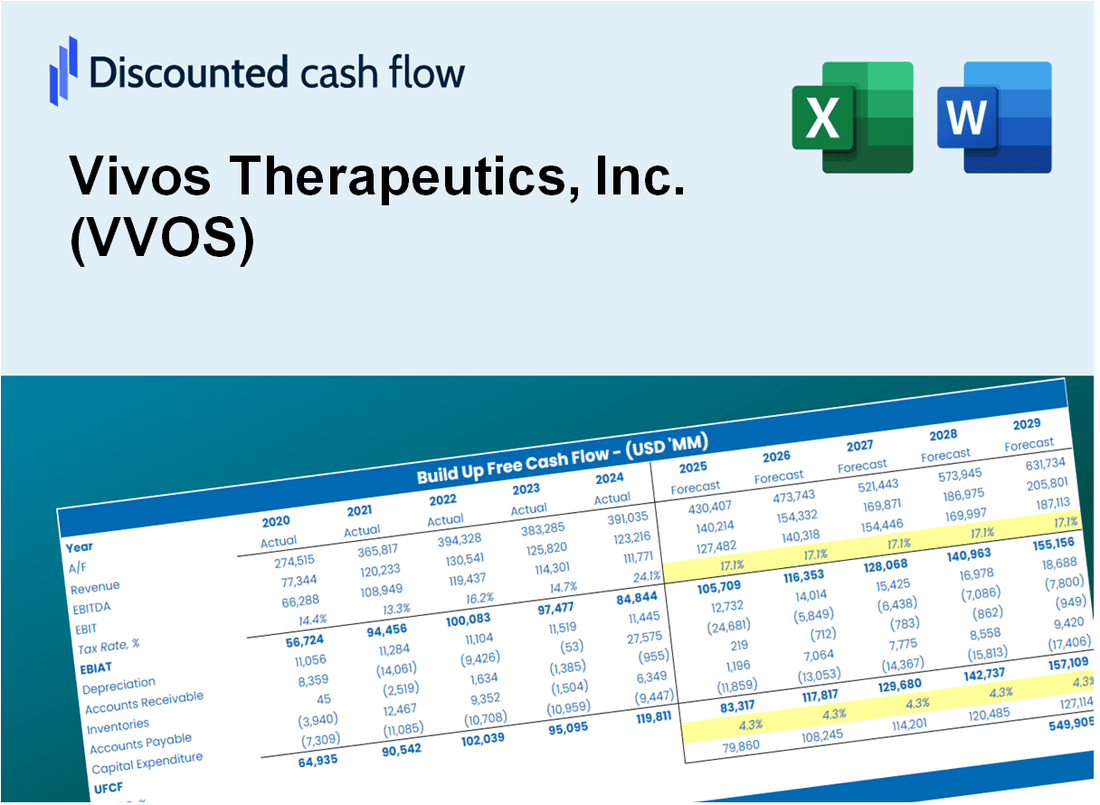
- Real-World Data: Historical data and forward-looking estimates (as indicated in the yellow cells).
- Forecast Flexibility: Adjust forecast assumptions such as revenue growth, EBITDA %, and WACC.
- Automatic Calculations: Instantly observe how your inputs affect Vivos Therapeutics' valuation.
- Professional Tool: Designed for investors, CFOs, consultants, and financial analysts.
- User-Friendly Design: Organized for clarity and ease of use, complete with step-by-step instructions.
Key Features
- 🔍 Real-Life VVOS Financials: Pre-filled historical and projected data for Vivos Therapeutics, Inc.
- ✏️ Fully Customizable Inputs: Adjust all critical parameters (yellow cells) like WACC, growth %, and tax rates.
- 📊 Professional DCF Valuation: Built-in formulas calculate Vivos' intrinsic value using the Discounted Cash Flow method.
- ⚡ Instant Results: Visualize Vivos' valuation instantly after making changes.
- Scenario Analysis: Test and compare outcomes for various financial assumptions side-by-side.
How It Works
- Step 1: Download the prebuilt Excel template featuring Vivos Therapeutics, Inc. (VVOS) data.
- Step 2: Review the pre-filled sheets to familiarize yourself with the essential metrics.
- Step 3: Adjust forecasts and assumptions in the editable yellow cells (WACC, growth, margins).
- Step 4: Immediately see the recalculated results, including Vivos Therapeutics, Inc.'s (VVOS) intrinsic value.
- Step 5: Utilize the outputs to make informed investment decisions or create reports.
Why Choose This Calculator for Vivos Therapeutics, Inc. (VVOS)?
- Accurate Data: Up-to-date Vivos Therapeutics financials provide dependable valuation outcomes.
- Customizable: Tailor essential parameters such as growth rates, WACC, and tax rates to fit your forecasts.
- Time-Saving: Pre-configured calculations save you the hassle of starting from the ground up.
- Professional-Grade Tool: Crafted for investors, analysts, and consultants in the biotech sector.
- User-Friendly: An intuitive design and clear instructions make it accessible for users of all levels.
Who Should Use This Product?
- Healthcare Professionals: Understand the latest advancements in sleep apnea treatment and apply them in practice.
- Researchers: Utilize data from clinical studies to enhance your research on sleep disorders.
- Investors: Evaluate your investment strategies and analyze market performance for Vivos Therapeutics, Inc. (VVOS).
- Analysts: Optimize your evaluations with a customizable financial model tailored for the healthcare sector.
- Patients: Learn about innovative treatment options for sleep apnea and their potential benefits.
What the Template Contains
- Historical Data: Includes Vivos Therapeutics, Inc.’s (VVOS) past financials and baseline forecasts.
- DCF and Levered DCF Models: Detailed templates to calculate Vivos Therapeutics, Inc.’s (VVOS) intrinsic value.
- WACC Sheet: Pre-built calculations for Weighted Average Cost of Capital specific to Vivos Therapeutics, Inc. (VVOS).
- Editable Inputs: Modify key drivers like growth rates, EBITDA %, and CAPEX assumptions tailored for Vivos Therapeutics, Inc. (VVOS).
- Quarterly and Annual Statements: A complete breakdown of Vivos Therapeutics, Inc.’s (VVOS) financials.
- Interactive Dashboard: Visualize valuation results and projections dynamically for Vivos Therapeutics, Inc. (VVOS).
Disclaimer
All information, articles, and product details provided on this website are for general informational and educational purposes only. We do not claim any ownership over, nor do we intend to infringe upon, any trademarks, copyrights, logos, brand names, or other intellectual property mentioned or depicted on this site. Such intellectual property remains the property of its respective owners, and any references here are made solely for identification or informational purposes, without implying any affiliation, endorsement, or partnership.
We make no representations or warranties, express or implied, regarding the accuracy, completeness, or suitability of any content or products presented. Nothing on this website should be construed as legal, tax, investment, financial, medical, or other professional advice. In addition, no part of this site—including articles or product references—constitutes a solicitation, recommendation, endorsement, advertisement, or offer to buy or sell any securities, franchises, or other financial instruments, particularly in jurisdictions where such activity would be unlawful.
All content is of a general nature and may not address the specific circumstances of any individual or entity. It is not a substitute for professional advice or services. Any actions you take based on the information provided here are strictly at your own risk. You accept full responsibility for any decisions or outcomes arising from your use of this website and agree to release us from any liability in connection with your use of, or reliance upon, the content or products found herein.