
|
Verizon Communications Inc. (VZ) تقييم DCF |
Fully Editable: Tailor To Your Needs In Excel Or Sheets
Professional Design: Trusted, Industry-Standard Templates
Investor-Approved Valuation Models
MAC/PC Compatible, Fully Unlocked
No Expertise Is Needed; Easy To Follow
Verizon Communications Inc. (VZ) Bundle
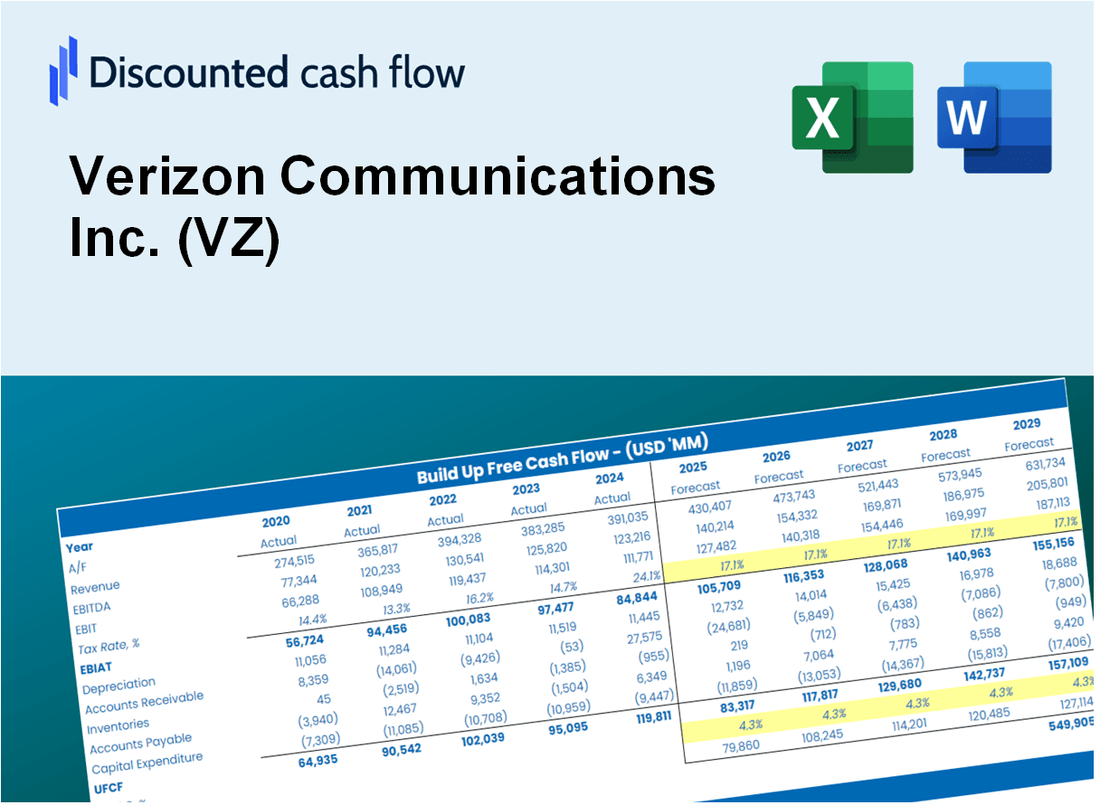
كسب إتقان تحليل تقييم Verizon Communications Inc. (VZ) باستخدام حاسبة DCF الحديثة لدينا! يأتي قالب Excel هذا مسبقًا ببيانات حقيقية (VZ) ، مما يتيح لك ضبط التوقعات والافتراضات لحساب القيمة الجوهرية لشركة Verizon Communications (VZ) بدقة.
Discounted Cash Flow (DCF) - (USD MM)
| Year | AY1 2020 |
AY2 2021 |
AY3 2022 |
AY4 2023 |
AY5 2024 |
FY1 2025 |
FY2 2026 |
FY3 2027 |
FY4 2028 |
FY5 2029 |
|---|---|---|---|---|---|---|---|---|---|---|
| Revenue | 128,292.0 | 133,613.0 | 136,835.0 | 133,974.0 | 134,788.0 | 136,498.4 | 138,230.5 | 139,984.5 | 141,760.8 | 143,559.7 |
| Revenue Growth, % | 0 | 4.15 | 2.41 | -2.09 | 0.60758 | 1.27 | 1.27 | 1.27 | 1.27 | 1.27 |
| EBITDA | 44,961.0 | 49,124.0 | 48,952.0 | 40,136.0 | 47,524.0 | 47,174.5 | 47,773.2 | 48,379.4 | 48,993.3 | 49,615.0 |
| EBITDA, % | 35.05 | 36.77 | 35.77 | 29.96 | 35.26 | 34.56 | 34.56 | 34.56 | 34.56 | 34.56 |
| Depreciation | 16,720.0 | 16,206.0 | 17,099.0 | 17,624.0 | 17,892.0 | 17,495.5 | 17,717.5 | 17,942.3 | 18,170.0 | 18,400.6 |
| Depreciation, % | 13.03 | 12.13 | 12.5 | 13.15 | 13.27 | 12.82 | 12.82 | 12.82 | 12.82 | 12.82 |
| EBIT | 28,241.0 | 32,918.0 | 31,853.0 | 22,512.0 | 29,632.0 | 29,679.0 | 30,055.6 | 30,437.0 | 30,823.3 | 31,214.4 |
| EBIT, % | 22.01 | 24.64 | 23.28 | 16.8 | 21.98 | 21.74 | 21.74 | 21.74 | 21.74 | 21.74 |
| Total Cash | 22,171.0 | 2,921.0 | 2,605.0 | 2,065.0 | 4,194.0 | 7,104.6 | 7,194.8 | 7,286.0 | 7,378.5 | 7,472.1 |
| Total Cash, percent | .0 | .0 | .0 | .0 | .0 | .0 | .0 | .0 | .0 | .0 |
| Account Receivables | 23,917.0 | 23,846.0 | 24,506.0 | 25,085.0 | 26,109.0 | 25,250.3 | 25,570.7 | 25,895.2 | 26,223.8 | 26,556.5 |
| Account Receivables, % | 18.64 | 17.85 | 17.91 | 18.72 | 19.37 | 18.5 | 18.5 | 18.5 | 18.5 | 18.5 |
| Inventories | 1,796.0 | 3,055.0 | 2,388.0 | 2,057.0 | 2,247.0 | 2,357.1 | 2,387.0 | 2,417.2 | 2,447.9 | 2,479.0 |
| Inventories, % | 1.4 | 2.29 | 1.75 | 1.54 | 1.67 | 1.73 | 1.73 | 1.73 | 1.73 | 1.73 |
| Accounts Payable | 6,667.0 | 8,040.0 | 8,750.0 | 10,021.0 | 10,425.0 | 8,960.5 | 9,074.2 | 9,189.4 | 9,306.0 | 9,424.1 |
| Accounts Payable, % | 5.2 | 6.02 | 6.39 | 7.48 | 7.73 | 6.56 | 6.56 | 6.56 | 6.56 | 6.56 |
| Capital Expenditure | -20,318.0 | -20,286.0 | -26,740.0 | -18,767.0 | -17,990.0 | -21,271.0 | -21,540.9 | -21,814.2 | -22,091.0 | -22,371.4 |
| Capital Expenditure, % | -15.84 | -15.18 | -19.54 | -14.01 | -13.35 | -15.58 | -15.58 | -15.58 | -15.58 | -15.58 |
| Tax Rate, % | 23.82 | 23.82 | 23.82 | 23.82 | 23.82 | 23.82 | 23.82 | 23.82 | 23.82 | 23.82 |
| EBITAT | 20,975.4 | 24,688.5 | 23,949.2 | 15,391.4 | 22,574.4 | 21,903.8 | 22,181.8 | 22,463.3 | 22,748.3 | 23,037.0 |
| Depreciation | ||||||||||
| Changes in Account Receivables | ||||||||||
| Changes in Inventories | ||||||||||
| Changes in Accounts Payable | ||||||||||
| Capital Expenditure | ||||||||||
| UFCF | -1,668.6 | 20,793.5 | 15,025.2 | 15,271.4 | 21,666.4 | 17,412.6 | 18,121.8 | 18,351.8 | 18,584.6 | 18,820.5 |
| WACC, % | 4.18 | 4.2 | 4.2 | 4.07 | 4.22 | 4.17 | 4.17 | 4.17 | 4.17 | 4.17 |
| PV UFCF | ||||||||||
| SUM PV UFCF | 80,766.7 | |||||||||
| Long Term Growth Rate, % | 0.50 | |||||||||
| Free cash flow (T + 1) | 18,915 | |||||||||
| Terminal Value | 514,788 | |||||||||
| Present Terminal Value | 419,592 | |||||||||
| Enterprise Value | 500,358 | |||||||||
| Net Debt | 164,163 | |||||||||
| Equity Value | 336,195 | |||||||||
| Diluted Shares Outstanding, MM | 4,218 | |||||||||
| Equity Value Per Share | 79.70 |
What You Will Get
- Real Verizon Data: Preloaded financials – from revenue to EBIT – based on actual and projected figures.
- Full Customization: Adjust all critical parameters (yellow cells) like WACC, growth %, and tax rates.
- Instant Valuation Updates: Automatic recalculations to analyze the impact of changes on Verizon’s fair value.
- Versatile Excel Template: Tailored for quick edits, scenario testing, and detailed projections.
- Time-Saving and Accurate: Skip building models from scratch while maintaining precision and flexibility.
Key Features
- Comprehensive DCF Calculator: Features detailed unlevered and levered DCF valuation models tailored for Verizon Communications Inc. (VZ).
- WACC Calculator: Ready-to-use Weighted Average Cost of Capital sheet with adjustable parameters.
- Customizable Forecast Assumptions: Alter growth rates, capital expenditures, and discount rates as needed.
- Integrated Financial Ratios: Evaluate profitability, leverage, and efficiency ratios specific to Verizon Communications Inc. (VZ).
- Interactive Dashboard and Charts: Visual representations highlight essential valuation metrics for streamlined analysis.
How It Works
- Step 1: Download the Excel file.
- Step 2: Review Verizon’s pre-filled financial data and forecasts.
- Step 3: Modify key inputs such as revenue growth, WACC, and tax rates (highlighted cells).
- Step 4: Observe the DCF model update in real-time as you adjust your assumptions.
- Step 5: Analyze the outputs and leverage the results for informed investment decisions.
Why Choose Verizon Communications Inc. (VZ)?
- Reliable Connectivity: Experience seamless communication with our advanced network technology.
- Comprehensive Coverage: Enjoy extensive network coverage across urban and rural areas.
- Innovative Solutions: Access cutting-edge services and products tailored to your needs.
- Customer-Centric Support: Benefit from dedicated customer service that prioritizes your satisfaction.
- Industry Leader: Trust a company recognized for its commitment to quality and performance.
Who Should Use This Product?
- Finance Students: Explore telecommunications valuation techniques and apply them using real data from Verizon Communications Inc. (VZ).
- Academics: Integrate advanced financial models into your curriculum or research focused on the telecom sector.
- Investors: Evaluate your investment strategies and analyze valuation outcomes for Verizon Communications Inc. (VZ).
- Analysts: Enhance your analysis with a customizable DCF model tailored for the telecommunications industry.
- Small Business Owners: Understand the valuation processes used for large public companies like Verizon Communications Inc. (VZ).
What the Template Contains
- Preloaded VZ Data: Historical and projected financial data, including revenue, EBIT, and capital expenditures.
- DCF and WACC Models: Professional-grade sheets for calculating intrinsic value and Weighted Average Cost of Capital.
- Editable Inputs: Yellow-highlighted cells for adjusting revenue growth, tax rates, and discount rates.
- Financial Statements: Comprehensive annual and quarterly financials for deeper analysis.
- Key Ratios: Profitability, leverage, and efficiency ratios to evaluate performance.
- Dashboard and Charts: Visual summaries of valuation outcomes and assumptions.
Disclaimer
All information, articles, and product details provided on this website are for general informational and educational purposes only. We do not claim any ownership over, nor do we intend to infringe upon, any trademarks, copyrights, logos, brand names, or other intellectual property mentioned or depicted on this site. Such intellectual property remains the property of its respective owners, and any references here are made solely for identification or informational purposes, without implying any affiliation, endorsement, or partnership.
We make no representations or warranties, express or implied, regarding the accuracy, completeness, or suitability of any content or products presented. Nothing on this website should be construed as legal, tax, investment, financial, medical, or other professional advice. In addition, no part of this site—including articles or product references—constitutes a solicitation, recommendation, endorsement, advertisement, or offer to buy or sell any securities, franchises, or other financial instruments, particularly in jurisdictions where such activity would be unlawful.
All content is of a general nature and may not address the specific circumstances of any individual or entity. It is not a substitute for professional advice or services. Any actions you take based on the information provided here are strictly at your own risk. You accept full responsibility for any decisions or outcomes arising from your use of this website and agree to release us from any liability in connection with your use of, or reliance upon, the content or products found herein.