
|
Dentsply Sirona Inc. (XRAY) DCF تقييم |
Fully Editable: Tailor To Your Needs In Excel Or Sheets
Professional Design: Trusted, Industry-Standard Templates
Investor-Approved Valuation Models
MAC/PC Compatible, Fully Unlocked
No Expertise Is Needed; Easy To Follow
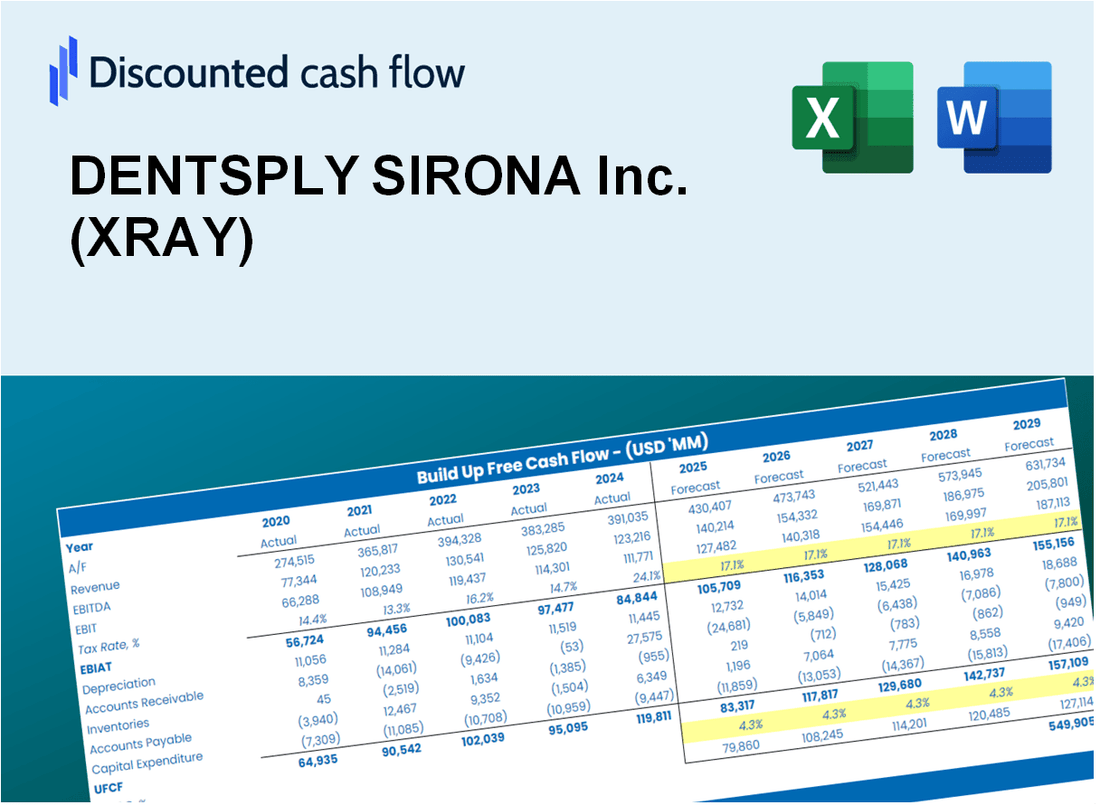
DENTSPLY SIRONA Inc. (XRAY) Bundle
عزز استراتيجياتك الاستثمارية مع DENTSPLY SIRONA Inc. (XRAY) حاسبة DCF! استكشف البيانات المالية الأصلية لـ Dentsply، واضبط تنبؤات النمو والنفقات، ولاحظ على الفور كيف تؤثر هذه التعديلات على القيمة الجوهرية لـ XRAY.
What You Will Receive
- Pre-Filled Financial Model: DENTSPLY SIRONA's actual data provides accurate DCF valuation.
- Comprehensive Forecast Control: Modify revenue growth, margins, WACC, and other essential drivers.
- Immediate Calculations: Automatic updates allow you to view results in real-time as you adjust inputs.
- Investor-Ready Template: A polished Excel file crafted for high-quality valuation presentations.
- Customizable and Reusable: Designed for adaptability, enabling repeated use for in-depth forecasts.
Key Features
- Customizable Forecast Inputs: Adjust essential metrics such as revenue growth, EBITDA %, and capital expenditures.
- Instant DCF Valuation: Quickly computes intrinsic value, NPV, and other financial metrics.
- High-Precision Accuracy: Leverages DENTSPLY SIRONA's real-world financial data for accurate valuation results.
- Effortless Scenario Analysis: Easily evaluate various assumptions and analyze different outcomes.
- Efficiency Booster: Streamline the valuation process without the hassle of creating complex models from the ground up.
How It Works
- 1. Access the Template: Download and open the Excel file containing DENTSPLY SIRONA Inc.'s (XRAY) financial data.
- 2. Modify Assumptions: Adjust key parameters such as growth projections, WACC, and capital investments.
- 3. Analyze Results in Real-Time: The DCF model automatically computes intrinsic value and NPV based on your inputs.
- 4. Explore Scenarios: Evaluate various forecasts to understand different valuation possibilities.
- 5. Present with Assurance: Deliver professional valuation findings to enhance your decision-making process.
Why Choose This Calculator for DENTSPLY SIRONA Inc. (XRAY)?
- Comprehensive Tool: Offers DCF, WACC, and financial ratio analyses all in one convenient package.
- Customizable Inputs: Modify the yellow-highlighted cells to explore different financial scenarios.
- Detailed Insights: Automatically computes DENTSPLY SIRONA's intrinsic value and Net Present Value.
- Preloaded Data: Contains historical and projected data for precise starting points.
- Professional Quality: Perfect for financial analysts, investors, and business consultants focused on the healthcare sector.
Who Should Use This Product?
- Investors: Evaluate DENTSPLY SIRONA Inc.’s (XRAY) performance before making investment decisions.
- CFOs and Financial Analysts: Optimize valuation methods and assess financial forecasts for DENTSPLY SIRONA Inc. (XRAY).
- Startup Founders: Discover how established companies like DENTSPLY SIRONA Inc. (XRAY) are valued in the market.
- Consultants: Provide comprehensive valuation reports for clients interested in DENTSPLY SIRONA Inc. (XRAY).
- Students and Educators: Utilize current data from DENTSPLY SIRONA Inc. (XRAY) to learn and teach valuation strategies.
What the Template Contains
- Historical Data: Includes DENTSPLY SIRONA Inc.'s past financials and baseline forecasts.
- DCF and Levered DCF Models: Detailed templates to calculate DENTSPLY SIRONA Inc.'s intrinsic value.
- WACC Sheet: Pre-built calculations for Weighted Average Cost of Capital.
- Editable Inputs: Modify key drivers like growth rates, EBITDA %, and CAPEX assumptions.
- Quarterly and Annual Statements: A complete breakdown of DENTSPLY SIRONA Inc.'s financials.
- Interactive Dashboard: Visualize valuation results and projections dynamically.
Disclaimer
All information, articles, and product details provided on this website are for general informational and educational purposes only. We do not claim any ownership over, nor do we intend to infringe upon, any trademarks, copyrights, logos, brand names, or other intellectual property mentioned or depicted on this site. Such intellectual property remains the property of its respective owners, and any references here are made solely for identification or informational purposes, without implying any affiliation, endorsement, or partnership.
We make no representations or warranties, express or implied, regarding the accuracy, completeness, or suitability of any content or products presented. Nothing on this website should be construed as legal, tax, investment, financial, medical, or other professional advice. In addition, no part of this site—including articles or product references—constitutes a solicitation, recommendation, endorsement, advertisement, or offer to buy or sell any securities, franchises, or other financial instruments, particularly in jurisdictions where such activity would be unlawful.
All content is of a general nature and may not address the specific circumstances of any individual or entity. It is not a substitute for professional advice or services. Any actions you take based on the information provided here are strictly at your own risk. You accept full responsibility for any decisions or outcomes arising from your use of this website and agree to release us from any liability in connection with your use of, or reliance upon, the content or products found herein.