
|
Anheuser-Busch InBev SA/NV (ABI.BR) DCF-Bewertung |
Fully Editable: Tailor To Your Needs In Excel Or Sheets
Professional Design: Trusted, Industry-Standard Templates
Investor-Approved Valuation Models
MAC/PC Compatible, Fully Unlocked
No Expertise Is Needed; Easy To Follow
Anheuser-Busch InBev SA/NV (ABI.BR) Bundle
Gewinnen Sie mit unserem ausgefeilten DCF-Taschenrechner Einblicke in Ihre Anheiser-Busch InBev SA/NV (ABIBR) -bewertungsanalyse! Diese Excel-Vorlage wurde mit realen (ABIBR-) Daten entwickelt und ermöglicht es Ihnen, Vorhersagen und Annahmen anzupassen, um den inneren Wert von Anheuser-Busch InBev SA/NV (ABIBB) genau zu bestimmen.
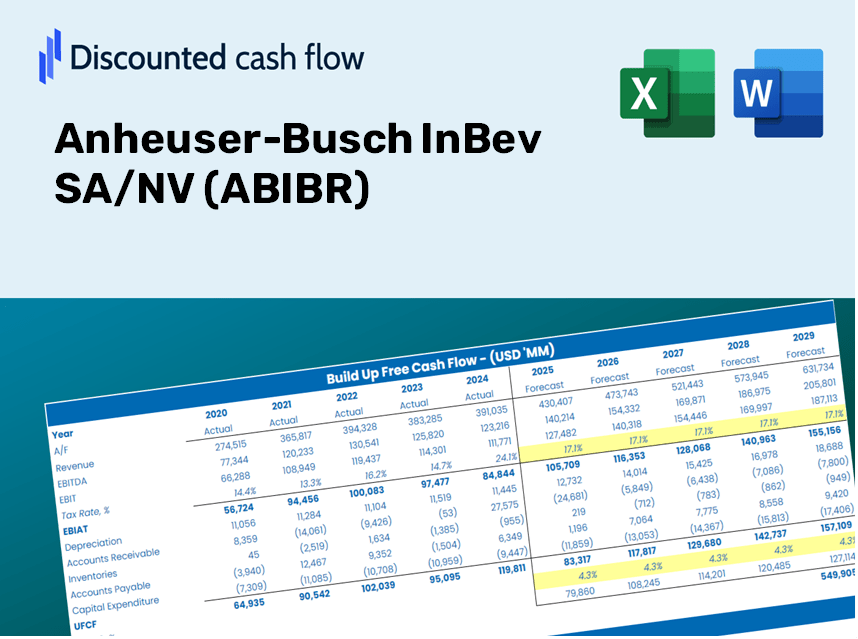
Discounted Cash Flow (DCF) - (USD MM)
| Year | AY1 2020 |
AY2 2021 |
AY3 2022 |
AY4 2023 |
AY5 2024 |
FY1 2025 |
FY2 2026 |
FY3 2027 |
FY4 2028 |
FY5 2029 |
|---|---|---|---|---|---|---|---|---|---|---|
| Revenue | 40,613.2 | 47,043.7 | 50,060.2 | 51,441.1 | 51,777.2 | 52,559.7 | 53,353.9 | 54,160.2 | 54,978.7 | 55,809.5 |
| Revenue Growth, % | 0 | 15.83 | 6.41 | 2.76 | 0.65342 | 1.51 | 1.51 | 1.51 | 1.51 | 1.51 |
| EBITDA | 10,012.7 | 15,409.8 | 16,443.3 | 16,517.8 | 17,582.5 | 16,432.8 | 16,681.2 | 16,933.2 | 17,189.1 | 17,448.9 |
| EBITDA, % | 24.65 | 32.76 | 32.85 | 32.11 | 33.96 | 31.27 | 31.27 | 31.27 | 31.27 | 31.27 |
| Depreciation | 4,183.4 | 4,376.6 | 4,399.1 | 4,687.6 | 4,802.8 | 4,917.4 | 4,991.8 | 5,067.2 | 5,143.8 | 5,221.5 |
| Depreciation, % | 10.3 | 9.3 | 8.79 | 9.11 | 9.28 | 9.36 | 9.36 | 9.36 | 9.36 | 9.36 |
| EBIT | 5,829.4 | 11,033.2 | 12,044.2 | 11,830.2 | 12,779.7 | 11,515.4 | 11,689.4 | 11,866.0 | 12,045.4 | 12,227.4 |
| EBIT, % | 14.35 | 23.45 | 24.06 | 23 | 24.68 | 21.91 | 21.91 | 21.91 | 21.91 | 21.91 |
| Total Cash | 13,555.9 | 10,736.1 | 8,660.4 | 9,008.7 | 9,871.5 | 11,571.3 | 11,746.2 | 11,923.7 | 12,103.8 | 12,286.8 |
| Total Cash, percent | .0 | .0 | .0 | .0 | .0 | .0 | .0 | .0 | .0 | .0 |
| Account Receivables | 4,447.6 | 4,398.2 | 4,967.4 | 5,520.1 | 4,769.0 | 5,273.3 | 5,353.0 | 5,433.9 | 5,516.0 | 5,599.3 |
| Account Receivables, % | 10.95 | 9.35 | 9.92 | 10.73 | 9.21 | 10.03 | 10.03 | 10.03 | 10.03 | 10.03 |
| Inventories | 3,803.9 | 4,577.5 | 5,652.6 | 4,732.6 | 4,279.5 | 5,030.3 | 5,106.4 | 5,183.5 | 5,261.9 | 5,341.4 |
| Inventories, % | 9.37 | 9.73 | 11.29 | 9.2 | 8.27 | 9.57 | 9.57 | 9.57 | 9.57 | 9.57 |
| Accounts Payable | 13,772.5 | 15,428.9 | 16,103.7 | 15,358.7 | 13,869.5 | 16,348.2 | 16,595.3 | 16,846.1 | 17,100.6 | 17,359.1 |
| Accounts Payable, % | 33.91 | 32.8 | 32.17 | 29.86 | 26.79 | 31.1 | 31.1 | 31.1 | 31.1 | 31.1 |
| Capital Expenditure | -3,275.5 | -4,886.0 | -4,470.1 | -4,017.9 | -3,346.5 | -4,378.7 | -4,444.9 | -4,512.0 | -4,580.2 | -4,649.4 |
| Capital Expenditure, % | -8.07 | -10.39 | -8.93 | -7.81 | -6.46 | -8.33 | -8.33 | -8.33 | -8.33 | -8.33 |
| Tax Rate, % | 44.6 | 44.6 | 44.6 | 44.6 | 44.6 | 44.6 | 44.6 | 44.6 | 44.6 | 44.6 |
| EBITAT | 3,939.5 | 6,088.3 | 7,548.5 | 6,925.2 | 7,080.4 | 6,894.9 | 6,999.1 | 7,104.8 | 7,212.2 | 7,321.2 |
| Depreciation | ||||||||||
| Changes in Account Receivables | ||||||||||
| Changes in Inventories | ||||||||||
| Changes in Accounts Payable | ||||||||||
| Capital Expenditure | ||||||||||
| UFCF | 10,368.3 | 6,511.0 | 6,508.1 | 7,217.1 | 8,251.6 | 8,657.2 | 7,637.3 | 7,752.7 | 7,869.9 | 7,988.8 |
| WACC, % | 5.83 | 5.57 | 5.73 | 5.64 | 5.57 | 5.67 | 5.67 | 5.67 | 5.67 | 5.67 |
| PV UFCF | ||||||||||
| SUM PV UFCF | 33,980.7 | |||||||||
| Long Term Growth Rate, % | 1.00 | |||||||||
| Free cash flow (T + 1) | 8,069 | |||||||||
| Terminal Value | 172,876 | |||||||||
| Present Terminal Value | 131,230 | |||||||||
| Enterprise Value | 165,210 | |||||||||
| Net Debt | 52,841 | |||||||||
| Equity Value | 112,369 | |||||||||
| Diluted Shares Outstanding, MM | 2,044 | |||||||||
| Equity Value Per Share | 54.98 |
What You Will Receive
- Authentic ABIBR Financials: Access historical and projected data for precise valuation.
- Customizable Inputs: Adjust WACC, tax rates, revenue growth, and capital expenditures as needed.
- Instant Calculations: Dynamic calculations for intrinsic value and NPV.
- Scenario Evaluation: Analyze various scenarios to assess Anheuser-Busch InBev's future prospects.
- User-Friendly Design: Designed for experts while remaining easy to navigate for newcomers.
Key Features
- Comprehensive DCF Calculator: Features detailed unlevered and levered DCF valuation models tailored for Anheuser-Busch InBev SA/NV (ABIBR).
- WACC Calculator: Pre-designed Weighted Average Cost of Capital sheet with flexible input options.
- Adjustable Forecast Assumptions: Customize growth rates, capital expenditures, and discount rates as needed.
- Integrated Financial Ratios: Evaluate profitability, leverage, and efficiency ratios specific to Anheuser-Busch InBev SA/NV (ABIBR).
- Interactive Dashboard and Charts: Visual representations of essential valuation metrics for straightforward analysis.
How It Works
- Step 1: Download the Excel file.
- Step 2: Examine Anheuser-Busch InBev’s pre-filled financial data and projections.
- Step 3: Adjust key inputs such as revenue growth, WACC, and tax rates (highlighted cells).
- Step 4: Observe the DCF model refresh automatically as you modify assumptions.
- Step 5: Review the outputs and leverage the results for your investment strategies.
Why Opt for This Calculator?
- Precision: Utilizes real Anheuser-Busch InBev financial data for optimal accuracy.
- Versatility: Crafted for users to easily adjust and experiment with various inputs.
- Efficiency: Eliminate the need to construct a DCF model from the ground up.
- Expert-Level: Created with the precision and functionality expected at the CFO level.
- Intuitive: Designed for simplicity, making it accessible even for those lacking advanced financial modeling skills.
Who Can Benefit from This Product?
- Finance Students: Master valuation methods and apply them using real-world data.
- Researchers: Enhance academic work by integrating industry-standard models into your studies.
- Investors: Challenge your hypotheses and evaluate the valuation metrics for Anheuser-Busch InBev SA/NV (ABIBR).
- Market Analysts: Optimize your analysis process with a customizable DCF model designed for efficiency.
- Entrepreneurs: Discover how major corporations like Anheuser-Busch InBev are valued in the market.
Contents of the Template
- Comprehensive DCF Model: A fully editable template featuring in-depth valuation calculations.
- Real-World Data: Anheuser-Busch InBev SA/NV's (ABIBR) historical and projected financials are included for your analysis.
- Customizable Parameters: Modify WACC, growth rates, and tax assumptions to explore different scenarios.
- Financial Statements: Detailed annual and quarterly financial statements for enhanced insights.
- Key Ratios: In-built analysis covering profitability, efficiency, and leverage metrics.
- Dashboard with Visual Outputs: Visual representations such as charts and tables for clear, actionable insights.
Disclaimer
All information, articles, and product details provided on this website are for general informational and educational purposes only. We do not claim any ownership over, nor do we intend to infringe upon, any trademarks, copyrights, logos, brand names, or other intellectual property mentioned or depicted on this site. Such intellectual property remains the property of its respective owners, and any references here are made solely for identification or informational purposes, without implying any affiliation, endorsement, or partnership.
We make no representations or warranties, express or implied, regarding the accuracy, completeness, or suitability of any content or products presented. Nothing on this website should be construed as legal, tax, investment, financial, medical, or other professional advice. In addition, no part of this site—including articles or product references—constitutes a solicitation, recommendation, endorsement, advertisement, or offer to buy or sell any securities, franchises, or other financial instruments, particularly in jurisdictions where such activity would be unlawful.
All content is of a general nature and may not address the specific circumstances of any individual or entity. It is not a substitute for professional advice or services. Any actions you take based on the information provided here are strictly at your own risk. You accept full responsibility for any decisions or outcomes arising from your use of this website and agree to release us from any liability in connection with your use of, or reliance upon, the content or products found herein.