
|
Versicherte Garantie Ltd. (vor) DCF -Bewertung |
Fully Editable: Tailor To Your Needs In Excel Or Sheets
Professional Design: Trusted, Industry-Standard Templates
Investor-Approved Valuation Models
MAC/PC Compatible, Fully Unlocked
No Expertise Is Needed; Easy To Follow
Assured Guaranty Ltd. (AGO) Bundle
Verbessern Sie Ihre Anlagestrategien mit dem DCF -Taschenrechner von Assured Garanty Ltd. (vor)! Nehmen Sie genaue Finanzdaten ein, passen Sie Wachstumsprognosen und -kosten an und beobachten Sie, wie sich diese Modifikationen in Echtzeit auf den inneren Wert von Assured Garanty Ltd. (AGO) auswirken.
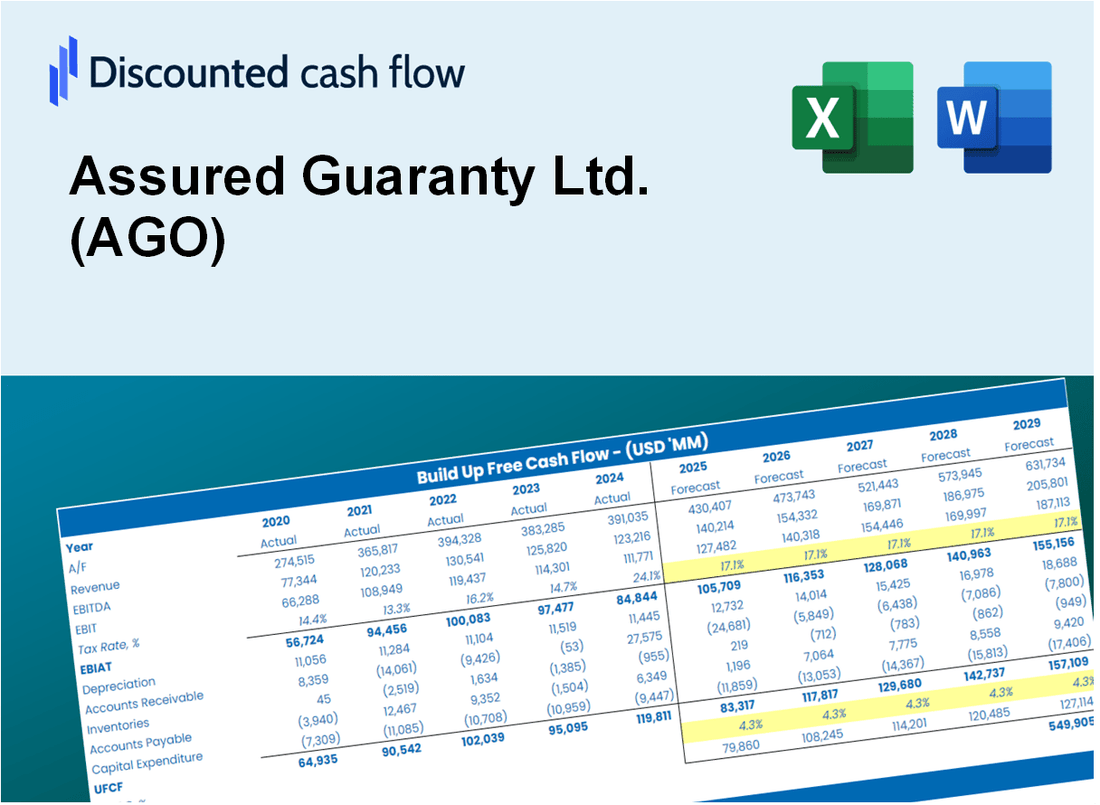
Discounted Cash Flow (DCF) - (USD MM)
| Year | AY1 2020 |
AY2 2021 |
AY3 2022 |
AY4 2023 |
AY5 2024 |
FY1 2025 |
FY2 2026 |
FY3 2027 |
FY4 2028 |
FY5 2029 |
|---|---|---|---|---|---|---|---|---|---|---|
| Revenue | 1,084.0 | 698.0 | 684.0 | 1,015.0 | 814.0 | 795.6 | 777.7 | 760.1 | 743.0 | 726.2 |
| Revenue Growth, % | 0 | -35.61 | -2.01 | 48.39 | -19.8 | -2.26 | -2.26 | -2.26 | -2.26 | -2.26 |
| EBITDA | 498.0 | 564.0 | 229.0 | 758.0 | 579.0 | 487.0 | 476.0 | 465.3 | 454.8 | 444.5 |
| EBITDA, % | 45.94 | 80.8 | 33.48 | 74.68 | 71.13 | 61.21 | 61.21 | 61.21 | 61.21 | 61.21 |
| Depreciation | .0 | .0 | .0 | .0 | .0 | .0 | .0 | .0 | .0 | .0 |
| Depreciation, % | 0 | 0 | 0 | 0 | 0 | 0 | 0 | 0 | 0 | 0 |
| EBIT | 498.0 | 564.0 | 229.0 | 758.0 | 579.0 | 487.0 | 476.0 | 465.3 | 454.8 | 444.5 |
| EBIT, % | 45.94 | 80.8 | 33.48 | 74.68 | 71.13 | 61.21 | 61.21 | 61.21 | 61.21 | 61.21 |
| Total Cash | 9,786.0 | 9,547.0 | 8,036.0 | 8,065.0 | 2,465.0 | 795.6 | 777.7 | 760.1 | 743.0 | 726.2 |
| Total Cash, percent | .0 | .0 | .0 | .0 | .0 | .0 | .0 | .0 | .0 | .0 |
| Account Receivables | 1,372.0 | 2,173.0 | 1,555.0 | 1,766.0 | 1,947.0 | 795.6 | 777.7 | 760.1 | 743.0 | 726.2 |
| Account Receivables, % | 126.57 | 311.32 | 227.34 | 173.99 | 239.19 | 100 | 100 | 100 | 100 | 100 |
| Inventories | .0 | -3,602.0 | -2,923.0 | -3,913.0 | .0 | -477.4 | -466.6 | -456.1 | -445.8 | -435.7 |
| Inventories, % | 0 | -516.05 | -427.34 | -385.52 | 0 | -60 | -60 | -60 | -60 | -60 |
| Accounts Payable | 33.0 | 16.0 | 1.0 | .0 | .0 | 8.7 | 8.5 | 8.3 | 8.1 | 8.0 |
| Accounts Payable, % | 3.04 | 2.29 | 0.1462 | 0 | 0 | 1.1 | 1.1 | 1.1 | 1.1 | 1.1 |
| Capital Expenditure | .0 | .0 | 25.0 | .0 | .0 | .0 | .0 | .0 | .0 | .0 |
| Capital Expenditure, % | 0 | 0 | 3.65 | 0 | 0 | 0 | 0 | 0 | 0 | 0 |
| Tax Rate, % | 22.95 | 22.95 | 22.95 | 22.95 | 22.95 | 22.95 | 22.95 | 22.95 | 22.95 | 22.95 |
| EBITAT | 436.5 | 459.9 | 191.9 | 838.6 | 446.1 | 418.8 | 409.4 | 400.1 | 391.1 | 382.3 |
| Depreciation | ||||||||||
| Changes in Account Receivables | ||||||||||
| Changes in Inventories | ||||||||||
| Changes in Accounts Payable | ||||||||||
| Capital Expenditure | ||||||||||
| UFCF | -902.5 | 3,243.9 | 140.9 | 1,616.6 | -3,647.9 | 2,056.3 | 416.4 | 407.0 | 397.8 | 388.8 |
| WACC, % | 7.17 | 7.08 | 7.11 | 7.34 | 7.02 | 7.15 | 7.15 | 7.15 | 7.15 | 7.15 |
| PV UFCF | ||||||||||
| SUM PV UFCF | 3,189.9 | |||||||||
| Long Term Growth Rate, % | 2.00 | |||||||||
| Free cash flow (T + 1) | 397 | |||||||||
| Terminal Value | 7,707 | |||||||||
| Present Terminal Value | 5,458 | |||||||||
| Enterprise Value | 8,648 | |||||||||
| Net Debt | 1,578 | |||||||||
| Equity Value | 7,070 | |||||||||
| Diluted Shares Outstanding, MM | 54 | |||||||||
| Equity Value Per Share | 130.20 |
What You Will Get
- Real AGO Financial Data: Pre-filled with Assured Guaranty Ltd.'s historical and projected data for precise analysis.
- Fully Editable Template: Modify key inputs like revenue growth, WACC, and EBITDA % with ease.
- Automatic Calculations: See Assured Guaranty Ltd.'s intrinsic value update instantly based on your changes.
- Professional Valuation Tool: Designed for investors, analysts, and consultants seeking accurate DCF results.
- User-Friendly Design: Simple structure and clear instructions for all experience levels.
Key Features
- Customizable Risk Parameters: Adjust essential inputs such as credit spreads, loss ratios, and recovery rates.
- Instant Credit Analysis: Provides real-time assessments of bond valuations and risk exposure.
- Industry-Leading Precision: Utilizes Assured Guaranty Ltd.'s (AGO) extensive data for accurate financial evaluations.
- Effortless Scenario Testing: Easily explore various market conditions and their potential impacts.
- Efficiency Booster: Streamlines the process of conducting comprehensive credit analyses without the hassle of manual calculations.
How It Works
- Download: Obtain the pre-configured Excel file containing Assured Guaranty Ltd.’s (AGO) financial data.
- Customize: Modify projections, such as premium growth, claims ratio, and discount rates.
- Update Automatically: The intrinsic value and NPV calculations refresh in real-time.
- Test Scenarios: Generate various forecasts and evaluate results instantly.
- Make Decisions: Leverage the valuation outcomes to inform your investment strategy.
Why Choose Assured Guaranty Ltd. (AGO)?
- Save Time: Quickly access comprehensive financial guarantees without starting from scratch.
- Enhance Reliability: Our robust data and risk assessments minimize uncertainties in your financial decisions.
- Fully Customizable: Adjust our services to meet your specific needs and expectations.
- Easy to Understand: Intuitive reports and visuals simplify the interpretation of your financial options.
- Endorsed by Professionals: Developed for industry leaders who prioritize accuracy and effectiveness.
Who Should Use Assured Guaranty Ltd. (AGO)?
- Finance Students: Discover credit enhancement techniques and apply them with real-world scenarios.
- Academics: Integrate industry-specific models into your research or teaching materials.
- Investors: Evaluate your investment strategies and assess risk management outcomes for Assured Guaranty Ltd. (AGO).
- Analysts: Optimize your analysis process with a customizable risk assessment model.
- Small Business Owners: Understand how large financial institutions like Assured Guaranty Ltd. (AGO) operate and are evaluated.
What the Template Contains
- Pre-Filled Data: Features Assured Guaranty Ltd.'s (AGO) historical financials and projections.
- Discounted Cash Flow Model: Editable DCF valuation model with automatic computations.
- Weighted Average Cost of Capital (WACC): A dedicated sheet for calculating WACC using customized inputs.
- Key Financial Ratios: Evaluate Assured Guaranty Ltd.'s (AGO) profitability, efficiency, and leverage metrics.
- Customizable Inputs: Easily modify revenue growth, margins, and tax rates.
- Clear Dashboard: Visuals and tables summarizing essential valuation outcomes.
Disclaimer
All information, articles, and product details provided on this website are for general informational and educational purposes only. We do not claim any ownership over, nor do we intend to infringe upon, any trademarks, copyrights, logos, brand names, or other intellectual property mentioned or depicted on this site. Such intellectual property remains the property of its respective owners, and any references here are made solely for identification or informational purposes, without implying any affiliation, endorsement, or partnership.
We make no representations or warranties, express or implied, regarding the accuracy, completeness, or suitability of any content or products presented. Nothing on this website should be construed as legal, tax, investment, financial, medical, or other professional advice. In addition, no part of this site—including articles or product references—constitutes a solicitation, recommendation, endorsement, advertisement, or offer to buy or sell any securities, franchises, or other financial instruments, particularly in jurisdictions where such activity would be unlawful.
All content is of a general nature and may not address the specific circumstances of any individual or entity. It is not a substitute for professional advice or services. Any actions you take based on the information provided here are strictly at your own risk. You accept full responsibility for any decisions or outcomes arising from your use of this website and agree to release us from any liability in connection with your use of, or reliance upon, the content or products found herein.