
|
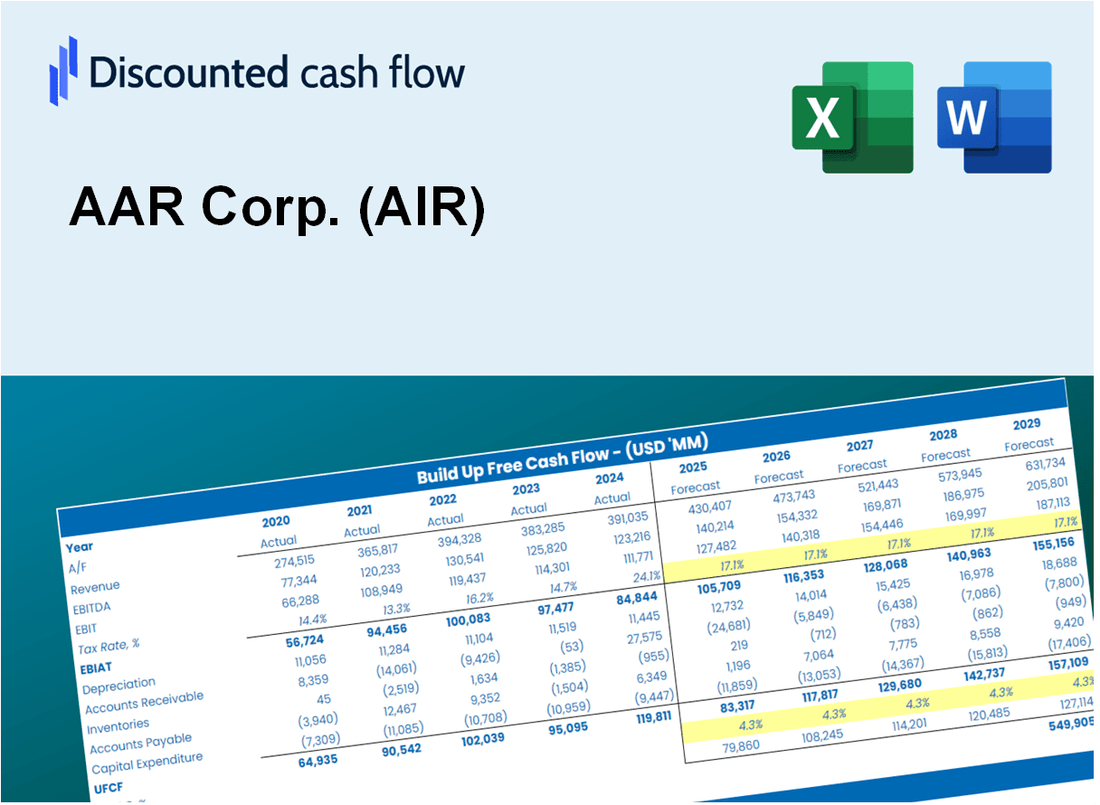
AAR Corp. (Luft) DCF -Bewertung |
Fully Editable: Tailor To Your Needs In Excel Or Sheets
Professional Design: Trusted, Industry-Standard Templates
Investor-Approved Valuation Models
MAC/PC Compatible, Fully Unlocked
No Expertise Is Needed; Easy To Follow
AAR Corp. (AIR) Bundle
Bewerten Sie die finanziellen Aussichten von AAR Corp. wie ein Experte! Dieser (Luft-) DCF-Taschenrechner verfügt über vorgefüllte Finanzdaten und ermöglicht es Ihnen, das Umsatzwachstum, WACC, Margen und andere wichtige Annahmen leicht zu ändern, um sich mit Ihren Vorhersagen auszurichten.
What You Will Get
- Real AAR Corp. Data: Preloaded financials – from revenue to EBIT – based on actual and projected figures for AAR Corp. (AIR).
- Full Customization: Adjust all critical parameters (yellow cells) like WACC, growth %, and tax rates specific to AAR Corp. (AIR).
- Instant Valuation Updates: Automatic recalculations to analyze the impact of changes on AAR Corp.'s (AIR) fair value.
- Versatile Excel Template: Tailored for quick edits, scenario testing, and detailed projections for AAR Corp. (AIR).
- Time-Saving and Accurate: Skip building models from scratch while maintaining precision and flexibility for AAR Corp. (AIR).
Key Features
- 🔍 Real-Life AAR Financials: Pre-filled historical and projected data for AAR Corp. (AIR).
- ✏️ Fully Customizable Inputs: Adjust all critical parameters (yellow cells) like WACC, growth %, and tax rates.
- 📊 Professional DCF Valuation: Built-in formulas calculate AAR’s intrinsic value using the Discounted Cash Flow method.
- ⚡ Instant Results: Visualize AAR’s valuation instantly after making changes.
- Scenario Analysis: Test and compare outcomes for various financial assumptions side-by-side.
How It Works
- Download: Obtain the pre-built Excel file featuring AAR Corp.'s (AIR) financial data.
- Customize: Modify projections, such as revenue growth, EBITDA %, and WACC.
- Update Automatically: Watch as intrinsic value and NPV calculations refresh in real-time.
- Test Scenarios: Develop various forecasts and instantly evaluate different outcomes.
- Make Decisions: Leverage the valuation insights to inform your investment approach.
Why Choose This Calculator for AAR Corp. (AIR)?
- User-Friendly Interface: Tailored for both novice and experienced users.
- Customizable Inputs: Adjust parameters to suit your financial analysis needs.
- Real-Time Valuation: Monitor immediate updates to AAR Corp.’s valuation as you change inputs.
- Preloaded Data: Comes equipped with AAR Corp.'s actual financial metrics for swift evaluations.
- Widely Endorsed: Favored by industry professionals for informed investment decisions.
Who Should Use This Product?
- Individual Investors: Make informed decisions about buying or selling AAR Corp. (AIR) stock.
- Financial Analysts: Streamline valuation processes with ready-to-use financial models for AAR Corp. (AIR).
- Consultants: Deliver professional valuation insights on AAR Corp. (AIR) to clients quickly and accurately.
- Business Owners: Understand how companies like AAR Corp. (AIR) are valued to guide your own strategy.
- Finance Students: Learn valuation techniques using real-world data and scenarios related to AAR Corp. (AIR).
What the Template Contains
- Pre-Filled Data: Includes AAR Corp.'s historical financials and forecasts.
- Discounted Cash Flow Model: Editable DCF valuation model with automatic calculations.
- Weighted Average Cost of Capital (WACC): A dedicated sheet for calculating WACC based on custom inputs.
- Key Financial Ratios: Analyze AAR Corp.'s profitability, efficiency, and leverage.
- Customizable Inputs: Edit revenue growth, margins, and tax rates with ease.
- Clear Dashboard: Charts and tables summarizing key valuation results.
Disclaimer
All information, articles, and product details provided on this website are for general informational and educational purposes only. We do not claim any ownership over, nor do we intend to infringe upon, any trademarks, copyrights, logos, brand names, or other intellectual property mentioned or depicted on this site. Such intellectual property remains the property of its respective owners, and any references here are made solely for identification or informational purposes, without implying any affiliation, endorsement, or partnership.
We make no representations or warranties, express or implied, regarding the accuracy, completeness, or suitability of any content or products presented. Nothing on this website should be construed as legal, tax, investment, financial, medical, or other professional advice. In addition, no part of this site—including articles or product references—constitutes a solicitation, recommendation, endorsement, advertisement, or offer to buy or sell any securities, franchises, or other financial instruments, particularly in jurisdictions where such activity would be unlawful.
All content is of a general nature and may not address the specific circumstances of any individual or entity. It is not a substitute for professional advice or services. Any actions you take based on the information provided here are strictly at your own risk. You accept full responsibility for any decisions or outcomes arising from your use of this website and agree to release us from any liability in connection with your use of, or reliance upon, the content or products found herein.