
|
Allegiant Travel Company (ALGT) DCF -Bewertung |
Fully Editable: Tailor To Your Needs In Excel Or Sheets
Professional Design: Trusted, Industry-Standard Templates
Investor-Approved Valuation Models
MAC/PC Compatible, Fully Unlocked
No Expertise Is Needed; Easy To Follow
Allegiant Travel Company (ALGT) Bundle
Entdecken Sie den finanziellen Ausblick der Allegiant Travel Company (ALGT) mit unserem benutzerfreundlichen DCF-Taschenrechner! Geben Sie Ihre Prognosen für Wachstum, Margen und Ausgaben ein, um den inneren Wert des Allegiant Travel Company (ALGT) zu berechnen und Ihren Investitionsansatz zu verbessern.
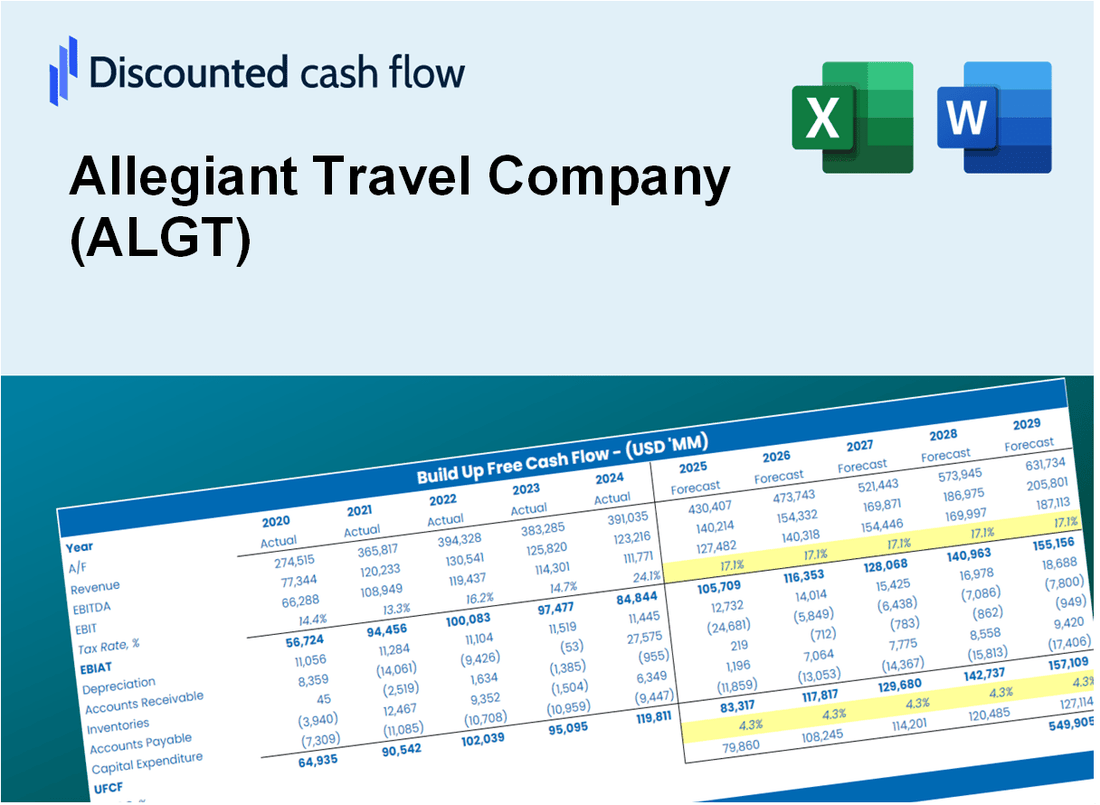
Discounted Cash Flow (DCF) - (USD MM)
| Year | AY1 2020 |
AY2 2021 |
AY3 2022 |
AY4 2023 |
AY5 2024 |
FY1 2025 |
FY2 2026 |
FY3 2027 |
FY4 2028 |
FY5 2029 |
|---|---|---|---|---|---|---|---|---|---|---|
| Revenue | 990.1 | 1,707.9 | 2,301.8 | 2,509.9 | 2,512.6 | 3,243.9 | 4,188.1 | 5,407.1 | 6,980.9 | 9,012.7 |
| Revenue Growth, % | 0 | 72.5 | 34.77 | 9.04 | 0.10885 | 29.11 | 29.11 | 29.11 | 29.11 | 29.11 |
| EBITDA | -127.2 | 446.1 | 305.6 | 490.2 | 60.9 | 314.7 | 406.3 | 524.6 | 677.3 | 874.4 |
| EBITDA, % | -12.84 | 26.12 | 13.27 | 19.53 | 2.42 | 9.7 | 9.7 | 9.7 | 9.7 | 9.7 |
| Depreciation | 176.3 | 181.0 | 197.5 | 223.1 | 258.3 | 364.3 | 470.4 | 607.3 | 784.0 | 1,012.2 |
| Depreciation, % | 17.8 | 10.6 | 8.58 | 8.89 | 10.28 | 11.23 | 11.23 | 11.23 | 11.23 | 11.23 |
| EBIT | -303.4 | 265.1 | 108.0 | 267.1 | -197.4 | -49.6 | -64.0 | -82.7 | -106.7 | -137.8 |
| EBIT, % | -30.65 | 15.52 | 4.69 | 10.64 | -7.86 | -1.53 | -1.53 | -1.53 | -1.53 | -1.53 |
| Total Cash | 685.2 | 1,220.2 | 955.1 | 831.0 | 797.6 | 1,602.5 | 2,068.9 | 2,671.1 | 3,448.5 | 4,452.2 |
| Total Cash, percent | .0 | .0 | .0 | .0 | .0 | .0 | .0 | .0 | .0 | .0 |
| Account Receivables | 192.2 | 62.7 | 106.6 | 70.7 | 90.4 | 221.4 | 285.9 | 369.1 | 476.5 | 615.2 |
| Account Receivables, % | 19.41 | 3.67 | 4.63 | 2.82 | 3.6 | 6.83 | 6.83 | 6.83 | 6.83 | 6.83 |
| Inventories | 24.0 | 27.5 | 35.5 | 36.3 | 36.1 | 54.9 | 70.9 | 91.5 | 118.1 | 152.5 |
| Inventories, % | 2.42 | 1.61 | 1.54 | 1.45 | 1.44 | 1.69 | 1.69 | 1.69 | 1.69 | 1.69 |
| Accounts Payable | 34.2 | 43.6 | 58.3 | 54.5 | 62.1 | 85.5 | 110.4 | 142.5 | 184.0 | 237.6 |
| Accounts Payable, % | 3.45 | 2.55 | 2.53 | 2.17 | 2.47 | 2.64 | 2.64 | 2.64 | 2.64 | 2.64 |
| Capital Expenditure | -280.2 | -243.6 | -434.7 | -870.5 | -300.2 | -701.2 | -905.3 | -1,168.8 | -1,509.0 | -1,948.2 |
| Capital Expenditure, % | -28.3 | -14.26 | -18.88 | -34.68 | -11.95 | -21.62 | -21.62 | -21.62 | -21.62 | -21.62 |
| Tax Rate, % | 22.11 | 22.11 | 22.11 | 22.11 | 22.11 | 22.11 | 22.11 | 22.11 | 22.11 | 22.11 |
| EBITAT | -154.7 | 204.7 | 54.4 | 197.5 | -153.7 | -32.8 | -42.3 | -54.6 | -70.5 | -91.1 |
| Depreciation | ||||||||||
| Changes in Account Receivables | ||||||||||
| Changes in Inventories | ||||||||||
| Changes in Accounts Payable | ||||||||||
| Capital Expenditure | ||||||||||
| UFCF | -440.7 | 277.6 | -220.0 | -418.7 | -207.4 | -496.1 | -532.8 | -687.9 | -888.1 | -1,146.5 |
| WACC, % | 5.84 | 6.72 | 5.82 | 6.61 | 6.74 | 6.35 | 6.35 | 6.35 | 6.35 | 6.35 |
| PV UFCF | ||||||||||
| SUM PV UFCF | -3,046.7 | |||||||||
| Long Term Growth Rate, % | 2.00 | |||||||||
| Free cash flow (T + 1) | -1,169 | |||||||||
| Terminal Value | -26,912 | |||||||||
| Present Terminal Value | -19,785 | |||||||||
| Enterprise Value | -22,832 | |||||||||
| Net Debt | 1,847 | |||||||||
| Equity Value | -24,679 | |||||||||
| Diluted Shares Outstanding, MM | 18 | |||||||||
| Equity Value Per Share | -1,382.44 |
What You Will Receive
- Customizable Excel Template: A fully editable Excel-based DCF Calculator featuring pre-filled real ALGT financials.
- Authentic Data: Historical performance data and future estimates (highlighted in the yellow cells).
- Flexible Forecasting: Modify forecast assumptions such as revenue growth, EBITDA %, and WACC.
- Instant Calculations: Quickly observe how your inputs affect Allegiant Travel Company’s valuation.
- Professional Resource: Designed for investors, CFOs, consultants, and financial analysts.
- Intuitive Layout: Organized for clarity and ease of navigation, complete with step-by-step guidance.
Key Features
- Customizable Financial Inputs: Adjust essential metrics such as ticket revenue, operating margins, and fleet expenditures.
- Instant DCF Valuation: Quickly computes intrinsic value, NPV, and additional financial metrics.
- High-Precision Accuracy: Incorporates Allegiant's actual financial data for credible valuation results.
- Simplified Scenario Testing: Easily evaluate various assumptions and analyze the resulting impacts.
- Efficiency Booster: Avoid the hassle of creating intricate valuation models from the ground up.
How It Works
- Step 1: Download the prebuilt Excel template featuring Allegiant Travel Company's (ALGT) data.
- Step 2: Navigate through the pre-filled sheets to familiarize yourself with the essential metrics.
- Step 3: Modify forecasts and assumptions in the editable yellow cells (WACC, growth, margins).
- Step 4: Immediately view updated results, including Allegiant Travel Company's (ALGT) intrinsic value.
- Step 5: Utilize the outputs to make informed investment decisions or create detailed reports.
Why Choose This Calculator for Allegiant Travel Company (ALGT)?
- All-in-One Solution: Features DCF, WACC, and comprehensive financial ratio analyses tailored for Allegiant Travel Company.
- Flexible Inputs: Modify the yellow-highlighted cells to explore different financial scenarios for (ALGT).
- In-Depth Analysis: Automatically computes Allegiant's intrinsic value and Net Present Value for informed decision-making.
- Preloaded Information: Includes historical and projected data to provide reliable starting points for (ALGT).
- Expert-Level Tool: Perfect for financial analysts, investors, and consultants focusing on Allegiant Travel Company.
Who Should Use This Product?
- Investors: Assess Allegiant Travel Company’s valuation before making investment decisions.
- CFOs and Financial Analysts: Optimize valuation methodologies and evaluate financial forecasts.
- Startup Founders: Gain insights into how established companies like Allegiant Travel are appraised.
- Consultants: Provide detailed valuation reports for clients in the travel industry.
- Students and Educators: Utilize current data to enhance learning and practice valuation skills.
What the Template Contains
- Historical Data: Includes Allegiant Travel Company's past financials and baseline forecasts.
- DCF and Levered DCF Models: Detailed templates to calculate Allegiant Travel Company's intrinsic value.
- WACC Sheet: Pre-built calculations for Weighted Average Cost of Capital.
- Editable Inputs: Modify key drivers like growth rates, EBITDA %, and CAPEX assumptions.
- Quarterly and Annual Statements: A complete breakdown of Allegiant Travel Company's financials.
- Interactive Dashboard: Visualize valuation results and projections dynamically.
Disclaimer
All information, articles, and product details provided on this website are for general informational and educational purposes only. We do not claim any ownership over, nor do we intend to infringe upon, any trademarks, copyrights, logos, brand names, or other intellectual property mentioned or depicted on this site. Such intellectual property remains the property of its respective owners, and any references here are made solely for identification or informational purposes, without implying any affiliation, endorsement, or partnership.
We make no representations or warranties, express or implied, regarding the accuracy, completeness, or suitability of any content or products presented. Nothing on this website should be construed as legal, tax, investment, financial, medical, or other professional advice. In addition, no part of this site—including articles or product references—constitutes a solicitation, recommendation, endorsement, advertisement, or offer to buy or sell any securities, franchises, or other financial instruments, particularly in jurisdictions where such activity would be unlawful.
All content is of a general nature and may not address the specific circumstances of any individual or entity. It is not a substitute for professional advice or services. Any actions you take based on the information provided here are strictly at your own risk. You accept full responsibility for any decisions or outcomes arising from your use of this website and agree to release us from any liability in connection with your use of, or reliance upon, the content or products found herein.