
|
Amgen Inc. (AMGN) DCF -Bewertung |
Fully Editable: Tailor To Your Needs In Excel Or Sheets
Professional Design: Trusted, Industry-Standard Templates
Investor-Approved Valuation Models
MAC/PC Compatible, Fully Unlocked
No Expertise Is Needed; Easy To Follow
Amgen Inc. (AMGN) Bundle
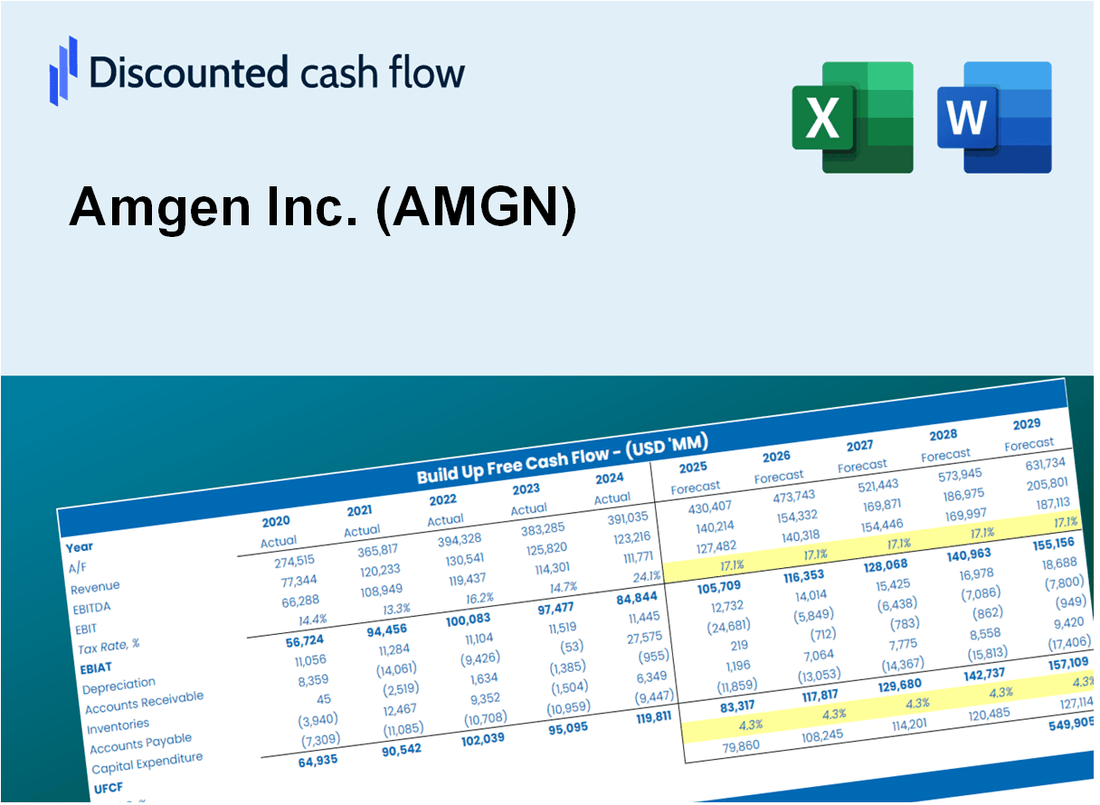
Gewinnen Sie mit unserem ausgefeilten DCF -Taschenrechner Einblicke in Ihre AMGN -Bewertungsanalyse in Ihrer Amgen Inc. (AMGN)! Mit realen (AMGN-) Daten können Sie mit dieser Excel -Vorlage Prognosen und Annahmen anpassen, um den intrinsischen Wert von Amgen Inc. (AMGN) genau zu bestimmen.
What You Will Get
- Real AMGN Financial Data: Pre-filled with Amgen’s historical and projected data for precise analysis.
- Fully Editable Template: Modify key inputs like revenue growth, WACC, and EBITDA % with ease.
- Automatic Calculations: See Amgen’s intrinsic value update instantly based on your changes.
- Professional Valuation Tool: Designed for investors, analysts, and consultants seeking accurate DCF results.
- User-Friendly Design: Simple structure and clear instructions for all experience levels.
Key Features
- Accurate Amgen Financials: Access reliable pre-loaded historical data and future projections for Amgen Inc. (AMGN).
- Customizable Forecast Assumptions: Modify yellow-highlighted cells such as WACC, growth rates, and profit margins.
- Dynamic Calculations: Automatic updates to DCF, Net Present Value (NPV), and cash flow analysis tailored for Amgen Inc. (AMGN).
- Visual Dashboard: User-friendly charts and summaries to easily visualize your valuation results for Amgen Inc. (AMGN).
- For Professionals and Beginners: An intuitive design crafted for investors, CFOs, and consultants focused on Amgen Inc. (AMGN).
How It Works
- Download: Access the ready-to-use Excel file containing Amgen Inc.'s (AMGN) financial data.
- Customize: Tailor forecasts, including revenue growth, EBITDA %, and WACC to your needs.
- Update Automatically: The intrinsic value and NPV calculations adjust in real-time.
- Test Scenarios: Generate multiple projections and compare results instantly.
- Make Decisions: Leverage the valuation outcomes to inform your investment strategy.
Why Choose This Calculator for Amgen Inc. (AMGN)?
- Comprehensive Tool: Incorporates DCF, WACC, and financial ratio analyses tailored for Amgen Inc. (AMGN).
- Customizable Inputs: Modify yellow-highlighted cells to explore different financial scenarios specific to Amgen Inc. (AMGN).
- Detailed Insights: Automatically computes Amgen Inc. (AMGN)’s intrinsic value and Net Present Value.
- Preloaded Data: Historical and forecasted data provide reliable starting points for analysis of Amgen Inc. (AMGN).
- Professional Quality: Perfect for financial analysts, investors, and business consultants focusing on Amgen Inc. (AMGN).
Who Should Use This Product?
- Investors: Evaluate Amgen Inc.'s (AMGN) valuation prior to making investment decisions.
- CFOs and Financial Analysts: Optimize valuation procedures and assess financial forecasts.
- Startup Founders: Understand the valuation methods of large public companies like Amgen Inc.
- Consultants: Create detailed valuation reports for your clients based on Amgen Inc.'s data.
- Students and Educators: Utilize actual market data to learn and teach valuation strategies.
What the Template Contains
- Pre-Filled DCF Model: Amgen Inc.’s financial data preloaded for immediate use.
- WACC Calculator: Detailed calculations for Weighted Average Cost of Capital.
- Financial Ratios: Evaluate Amgen Inc.’s profitability, leverage, and efficiency.
- Editable Inputs: Change assumptions such as growth, margins, and CAPEX to fit your scenarios.
- Financial Statements: Annual and quarterly reports to support detailed analysis.
- Interactive Dashboard: Easily visualize key valuation metrics and results.
Disclaimer
All information, articles, and product details provided on this website are for general informational and educational purposes only. We do not claim any ownership over, nor do we intend to infringe upon, any trademarks, copyrights, logos, brand names, or other intellectual property mentioned or depicted on this site. Such intellectual property remains the property of its respective owners, and any references here are made solely for identification or informational purposes, without implying any affiliation, endorsement, or partnership.
We make no representations or warranties, express or implied, regarding the accuracy, completeness, or suitability of any content or products presented. Nothing on this website should be construed as legal, tax, investment, financial, medical, or other professional advice. In addition, no part of this site—including articles or product references—constitutes a solicitation, recommendation, endorsement, advertisement, or offer to buy or sell any securities, franchises, or other financial instruments, particularly in jurisdictions where such activity would be unlawful.
All content is of a general nature and may not address the specific circumstances of any individual or entity. It is not a substitute for professional advice or services. Any actions you take based on the information provided here are strictly at your own risk. You accept full responsibility for any decisions or outcomes arising from your use of this website and agree to release us from any liability in connection with your use of, or reliance upon, the content or products found herein.