
|
Braemar Hotels & Resorts Inc. (BHR) DCF -Bewertung |
Fully Editable: Tailor To Your Needs In Excel Or Sheets
Professional Design: Trusted, Industry-Standard Templates
Investor-Approved Valuation Models
MAC/PC Compatible, Fully Unlocked
No Expertise Is Needed; Easy To Follow
Braemar Hotels & Resorts Inc. (BHR) Bundle
Entdecken Sie das wahre Potenzial von Braemar -Hotels & Resorts Inc. (BHR) mit unserem erweiterten DCF -Taschenrechner! Passen Sie die wichtigsten Annahmen an, erkunden Sie verschiedene Szenarien und bewerten Sie, wie sich Änderungen auf die Bewertung von Braemar -Hotels auswirken & Resorts Inc. (BHR) - Alles innerhalb einer einzelnen Excel -Vorlage.
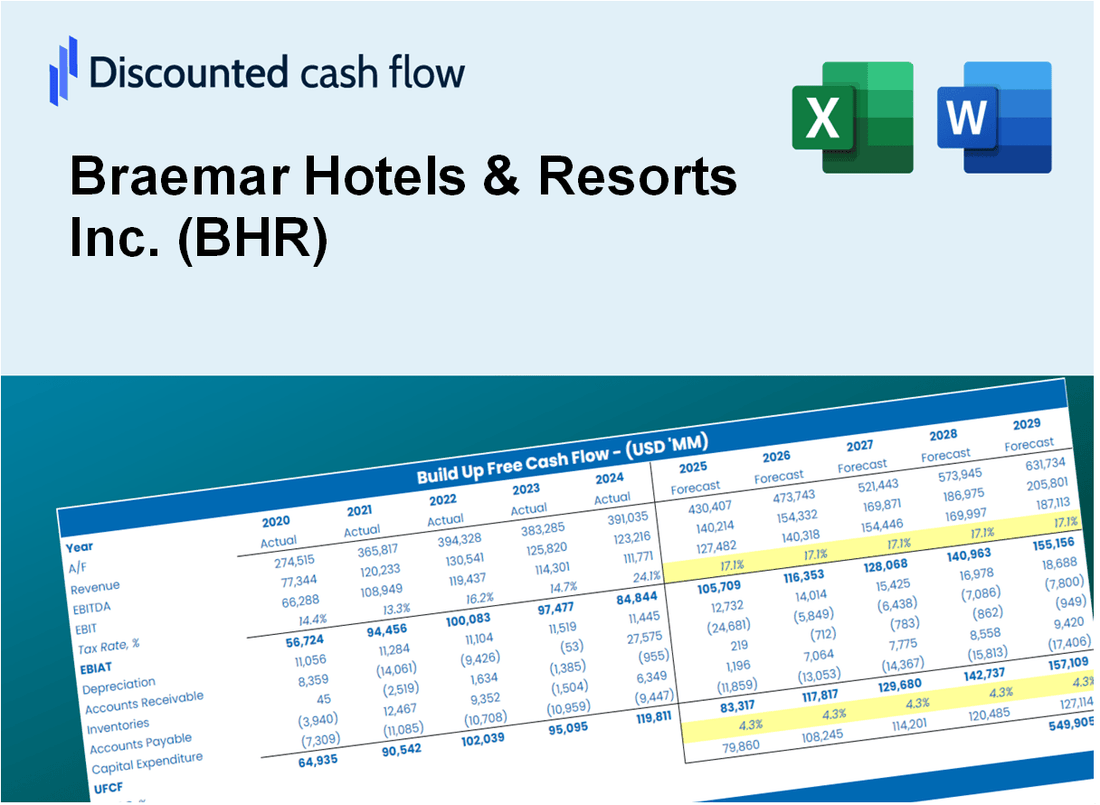
Discounted Cash Flow (DCF) - (USD MM)
| Year | AY1 2020 |
AY2 2021 |
AY3 2022 |
AY4 2023 |
AY5 2024 |
FY1 2025 |
FY2 2026 |
FY3 2027 |
FY4 2028 |
FY5 2029 |
|---|---|---|---|---|---|---|---|---|---|---|
| Revenue | 227.0 | 427.5 | 669.6 | 739.3 | 728.4 | 1,008.7 | 1,396.8 | 1,934.3 | 2,678.6 | 3,709.3 |
| Revenue Growth, % | 0 | 88.37 | 56.61 | 10.42 | -1.48 | 38.48 | 38.48 | 38.48 | 38.48 | 38.48 |
| EBITDA | -9.8 | 73.6 | 154.2 | 160.0 | 227.9 | 179.3 | 248.2 | 343.8 | 476.1 | 659.2 |
| EBITDA, % | -4.31 | 17.21 | 23.02 | 21.64 | 31.29 | 17.77 | 17.77 | 17.77 | 17.77 | 17.77 |
| Depreciation | 74.2 | 74.3 | 78.6 | 93.7 | 99.2 | 177.7 | 246.1 | 340.8 | 472.0 | 653.6 |
| Depreciation, % | 32.69 | 17.37 | 11.74 | 12.68 | 13.62 | 17.62 | 17.62 | 17.62 | 17.62 | 17.62 |
| EBIT | -84.0 | -.7 | 75.6 | 66.3 | 128.7 | 1.5 | 2.1 | 2.9 | 4.1 | 5.7 |
| EBIT, % | -37 | -0.16045 | 11.28 | 8.96 | 17.67 | 0.15235 | 0.15235 | 0.15235 | 0.15235 | 0.15235 |
| Total Cash | 78.6 | 216.0 | 261.5 | 88.4 | 135.5 | 312.2 | 432.4 | 598.8 | 829.2 | 1,148.2 |
| Total Cash, percent | .0 | .0 | .0 | .0 | .0 | .0 | .0 | .0 | .0 | .0 |
| Account Receivables | 26.8 | 52.9 | 79.0 | 56.9 | 62.9 | 105.6 | 146.2 | 202.5 | 280.4 | 388.3 |
| Account Receivables, % | 11.82 | 12.38 | 11.8 | 7.7 | 8.64 | 10.47 | 10.47 | 10.47 | 10.47 | 10.47 |
| Inventories | 2.6 | 3.1 | 5.2 | 5.0 | 4.7 | 8.0 | 11.0 | 15.3 | 21.2 | 29.3 |
| Inventories, % | 1.12 | 0.73162 | 0.78228 | 0.67668 | 0.6403 | 0.79096 | 0.79096 | 0.79096 | 0.79096 | 0.79096 |
| Accounts Payable | 61.8 | 96.3 | 134.0 | 100.5 | 143.6 | 207.9 | 287.9 | 398.6 | 552.0 | 764.5 |
| Accounts Payable, % | 27.21 | 22.53 | 20.01 | 13.59 | 19.71 | 20.61 | 20.61 | 20.61 | 20.61 | 20.61 |
| Capital Expenditure | -25.6 | -25.6 | -49.1 | -.1 | -70.6 | -69.2 | -95.8 | -132.7 | -183.7 | -254.4 |
| Capital Expenditure, % | -11.26 | -6 | -7.34 | -0.01014414 | -9.69 | -6.86 | -6.86 | -6.86 | -6.86 | -6.86 |
| Tax Rate, % | 108.22 | 108.22 | 108.22 | 108.22 | 108.22 | 108.22 | 108.22 | 108.22 | 108.22 | 108.22 |
| EBITAT | -68.5 | -.6 | 57.4 | 64.1 | -10.6 | 1.0 | 1.4 | 2.0 | 2.8 | 3.8 |
| Depreciation | ||||||||||
| Changes in Account Receivables | ||||||||||
| Changes in Inventories | ||||||||||
| Changes in Accounts Payable | ||||||||||
| Capital Expenditure | ||||||||||
| UFCF | 12.6 | 55.9 | 96.3 | 146.6 | 55.5 | 127.9 | 188.0 | 260.4 | 360.6 | 499.4 |
| WACC, % | 7.22 | 7.44 | 6.79 | 8.38 | 0.96893 | 6.16 | 6.16 | 6.16 | 6.16 | 6.16 |
| PV UFCF | ||||||||||
| SUM PV UFCF | 1,159.2 | |||||||||
| Long Term Growth Rate, % | 3.40 | |||||||||
| Free cash flow (T + 1) | 516 | |||||||||
| Terminal Value | 18,701 | |||||||||
| Present Terminal Value | 13,869 | |||||||||
| Enterprise Value | 15,028 | |||||||||
| Net Debt | 1,095 | |||||||||
| Equity Value | 13,933 | |||||||||
| Diluted Shares Outstanding, MM | 67 | |||||||||
| Equity Value Per Share | 209.52 |
What You Will Get
- Real Braemar Data: Preloaded financials – from revenue to EBIT – based on actual and projected figures for Braemar Hotels & Resorts Inc. (BHR).
- Full Customization: Adjust all critical parameters (yellow cells) like WACC, growth %, and tax rates to fit your analysis.
- Instant Valuation Updates: Automatic recalculations to assess the impact of changes on Braemar's fair value.
- Versatile Excel Template: Designed for quick edits, scenario testing, and comprehensive projections.
- Time-Saving and Accurate: Avoid building models from scratch while ensuring precision and flexibility in your evaluations.
Key Features
- Comprehensive Financial Data: Gain access to reliable historical data and future forecasts for Braemar Hotels & Resorts Inc. (BHR).
- Adjustable Forecast Parameters: Modify highlighted fields such as WACC, growth rates, and profit margins to tailor your analysis.
- Real-Time Calculations: Enjoy automatic updates for DCF, Net Present Value (NPV), and cash flow assessments.
- User-Friendly Dashboard: Utilize intuitive charts and summaries for a clear view of your valuation outcomes.
- Designed for All Skill Levels: A straightforward and accessible layout suitable for investors, CFOs, and consultants alike.
How It Works
- Step 1: Download the prebuilt Excel template featuring Braemar Hotels & Resorts Inc. (BHR) data.
- Step 2: Navigate through the pre-filled sheets to familiarize yourself with the essential metrics.
- Step 3: Update projections and assumptions in the editable yellow cells (WACC, growth, margins).
- Step 4: Instantly see the recalculated results, including the intrinsic value of Braemar Hotels & Resorts Inc. (BHR).
- Step 5: Make well-informed investment decisions or create reports based on the outputs.
Why Choose Braemar Hotels & Resorts Inc. (BHR) Calculator?
- Accuracy: Utilizes real financial data from Braemar Hotels & Resorts for precise calculations.
- Flexibility: Allows users to easily adjust and test various input parameters.
- Time-Saving: Eliminates the need to create complex financial models from the ground up.
- Professional-Grade: Built with the expertise and standards expected at the CFO level.
- User-Friendly: Intuitive design makes it accessible for users of all financial backgrounds.
Who Should Use This Product?
- Individual Investors: Make informed decisions about buying or selling Braemar Hotels & Resorts Inc. (BHR) stock.
- Financial Analysts: Enhance valuation assessments with comprehensive financial models tailored for Braemar Hotels & Resorts Inc. (BHR).
- Consultants: Provide precise valuation insights for clients focused on the hospitality sector, particularly Braemar Hotels & Resorts Inc. (BHR).
- Business Owners: Gain insights into the valuation of hospitality companies like Braemar Hotels & Resorts Inc. (BHR) to inform your own business strategies.
- Finance Students: Explore valuation methodologies using real-time data and case studies related to Braemar Hotels & Resorts Inc. (BHR).
What the Template Contains
- Historical Data: Includes Braemar Hotels & Resorts Inc.'s (BHR) past financials and baseline forecasts.
- DCF and Levered DCF Models: Detailed templates to calculate Braemar Hotels & Resorts Inc.'s (BHR) intrinsic value.
- WACC Sheet: Pre-built calculations for Weighted Average Cost of Capital.
- Editable Inputs: Modify key drivers like growth rates, EBITDA %, and CAPEX assumptions.
- Quarterly and Annual Statements: A complete breakdown of Braemar Hotels & Resorts Inc.'s (BHR) financials.
- Interactive Dashboard: Visualize valuation results and projections dynamically.
Disclaimer
All information, articles, and product details provided on this website are for general informational and educational purposes only. We do not claim any ownership over, nor do we intend to infringe upon, any trademarks, copyrights, logos, brand names, or other intellectual property mentioned or depicted on this site. Such intellectual property remains the property of its respective owners, and any references here are made solely for identification or informational purposes, without implying any affiliation, endorsement, or partnership.
We make no representations or warranties, express or implied, regarding the accuracy, completeness, or suitability of any content or products presented. Nothing on this website should be construed as legal, tax, investment, financial, medical, or other professional advice. In addition, no part of this site—including articles or product references—constitutes a solicitation, recommendation, endorsement, advertisement, or offer to buy or sell any securities, franchises, or other financial instruments, particularly in jurisdictions where such activity would be unlawful.
All content is of a general nature and may not address the specific circumstances of any individual or entity. It is not a substitute for professional advice or services. Any actions you take based on the information provided here are strictly at your own risk. You accept full responsibility for any decisions or outcomes arising from your use of this website and agree to release us from any liability in connection with your use of, or reliance upon, the content or products found herein.