
|
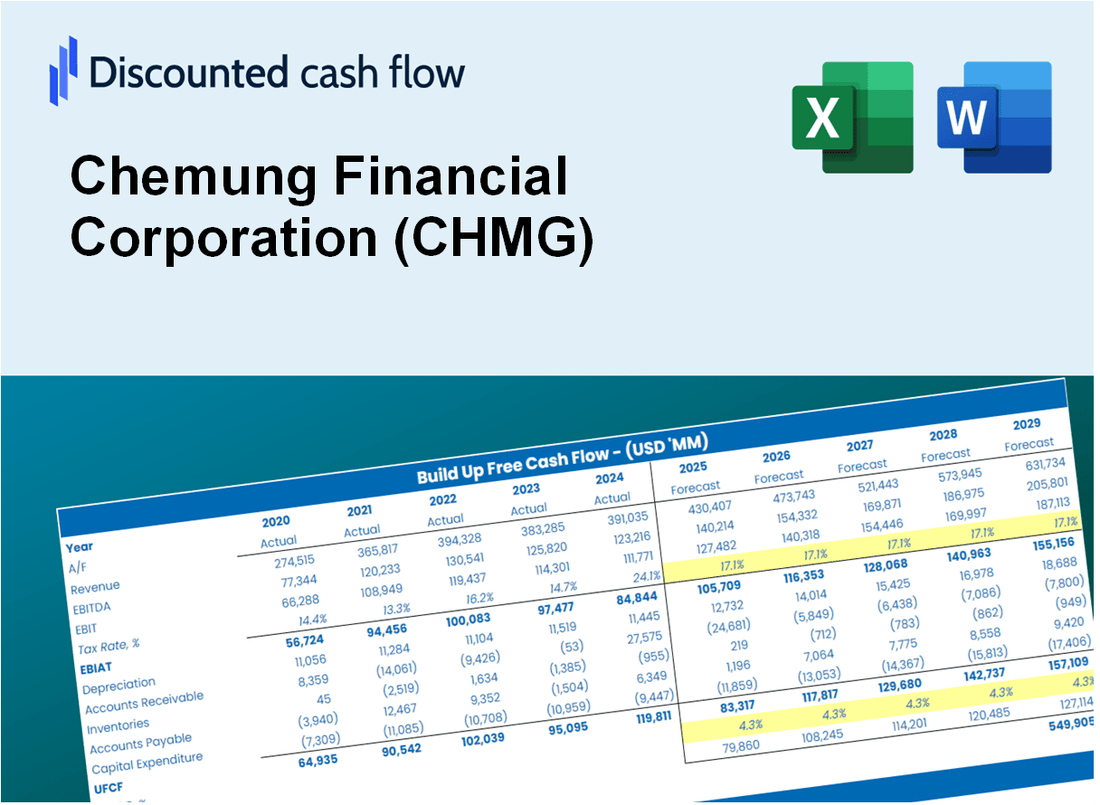
DCF -Bewertung der Chemung Financial Corporation (CHMG) |
Fully Editable: Tailor To Your Needs In Excel Or Sheets
Professional Design: Trusted, Industry-Standard Templates
Investor-Approved Valuation Models
MAC/PC Compatible, Fully Unlocked
No Expertise Is Needed; Easy To Follow
Chemung Financial Corporation (CHMG) Bundle
Bewerten Sie die Finanzaussichten der Chemung Financial Corporation (CHMG) wie ein Experte! Dieser (CHMG) DCF-Taschenrechner bietet Ihnen vorgefüllte Finanzdaten und ermöglicht eine vollständige Anpassung, um das Umsatzwachstum, WACC, Margen und andere kritische Annahmen zu ändern, um sich an Ihren Projektionen zu übereinstimmen.
What You Will Receive
- Comprehensive Financial Model: Utilize Chemung Financial Corporation’s (CHMG) actual data for accurate DCF valuation.
- Complete Forecasting Control: Modify revenue growth, profit margins, WACC, and other essential metrics.
- Real-Time Calculations: Automatic updates provide immediate results as you adjust parameters.
- Professional-Grade Template: A polished Excel file crafted for high-quality valuation presentations.
- Flexible and Reusable: Designed for adaptability, allowing for repeated application in detailed financial projections.
Key Features
- Comprehensive Financial Data: Access Chemung Financial Corporation’s (CHMG) historical financial statements and pre-populated forecasts.
- Customizable Inputs: Modify WACC, tax rates, revenue growth, and EBITDA margins to suit your analysis.
- Real-Time Insights: Observe the recalculation of Chemung Financial’s (CHMG) intrinsic value instantly.
- Intuitive Visualizations: Dashboard graphs illustrate valuation outcomes and essential metrics clearly.
- Designed for Precision: A reliable tool tailored for analysts, investors, and finance professionals.
How It Works
- Step 1: Download the Excel file.
- Step 2: Review pre-entered Chemung Financial Corporation (CHMG) data (historical and projected).
- Step 3: Adjust key assumptions (yellow cells) based on your analysis.
- Step 4: View automatic recalculations for Chemung Financial Corporation’s intrinsic value.
- Step 5: Use the outputs for investment decisions or reporting.
Why Choose This Calculator for Chemung Financial Corporation (CHMG)?
- All-in-One Solution: Combines DCF analysis, WACC calculations, and key financial ratios seamlessly.
- Flexible Inputs: Easily modify yellow-highlighted fields to explore different financial scenarios.
- In-Depth Analysis: Automatically computes Chemung Financial’s intrinsic value and Net Present Value.
- Pre-Loaded Information: Access to historical and projected data for reliable analysis.
- Expert-Level Tool: Perfect for financial analysts, investors, and business advisors focused on (CHMG).
Who Should Use This Product?
- Investors: Assess Chemung Financial Corporation’s (CHMG) valuation prior to making investment decisions.
- CFOs and Financial Analysts: Enhance valuation methodologies and evaluate financial forecasts.
- Startup Founders: Understand the valuation practices of established financial institutions like Chemung Financial Corporation.
- Consultants: Provide comprehensive valuation analyses and reports for clients in the financial sector.
- Students and Educators: Utilize current market data to learn and teach valuation strategies effectively.
What the Template Contains
- Preloaded CHMG Data: Historical and projected financial data, including revenue, EBIT, and capital expenditures.
- DCF and WACC Models: Professional-grade sheets for calculating intrinsic value and Weighted Average Cost of Capital.
- Editable Inputs: Yellow-highlighted cells for adjusting revenue growth, tax rates, and discount rates.
- Financial Statements: Comprehensive annual and quarterly financials for deeper analysis.
- Key Ratios: Profitability, leverage, and efficiency ratios to evaluate performance.
- Dashboard and Charts: Visual summaries of valuation outcomes and assumptions.
Disclaimer
All information, articles, and product details provided on this website are for general informational and educational purposes only. We do not claim any ownership over, nor do we intend to infringe upon, any trademarks, copyrights, logos, brand names, or other intellectual property mentioned or depicted on this site. Such intellectual property remains the property of its respective owners, and any references here are made solely for identification or informational purposes, without implying any affiliation, endorsement, or partnership.
We make no representations or warranties, express or implied, regarding the accuracy, completeness, or suitability of any content or products presented. Nothing on this website should be construed as legal, tax, investment, financial, medical, or other professional advice. In addition, no part of this site—including articles or product references—constitutes a solicitation, recommendation, endorsement, advertisement, or offer to buy or sell any securities, franchises, or other financial instruments, particularly in jurisdictions where such activity would be unlawful.
All content is of a general nature and may not address the specific circumstances of any individual or entity. It is not a substitute for professional advice or services. Any actions you take based on the information provided here are strictly at your own risk. You accept full responsibility for any decisions or outcomes arising from your use of this website and agree to release us from any liability in connection with your use of, or reliance upon, the content or products found herein.