
|
Civista Bancshares, Inc. (Civb) DCF -Bewertung |
Fully Editable: Tailor To Your Needs In Excel Or Sheets
Professional Design: Trusted, Industry-Standard Templates
Investor-Approved Valuation Models
MAC/PC Compatible, Fully Unlocked
No Expertise Is Needed; Easy To Follow
Civista Bancshares, Inc. (CIVB) Bundle
Verbessern Sie Ihre Investitionsauswahl mit dem DCF -Taschenrechner von Civista Bancshares, Inc. (CIVB)! Verwenden Sie authentische Finanzdaten von Civista, passen Sie Wachstumsprojektionen und -kosten an und beobachten Sie sofort, wie sich diese Modifikationen auf den inneren Wert von Civista auswirken.
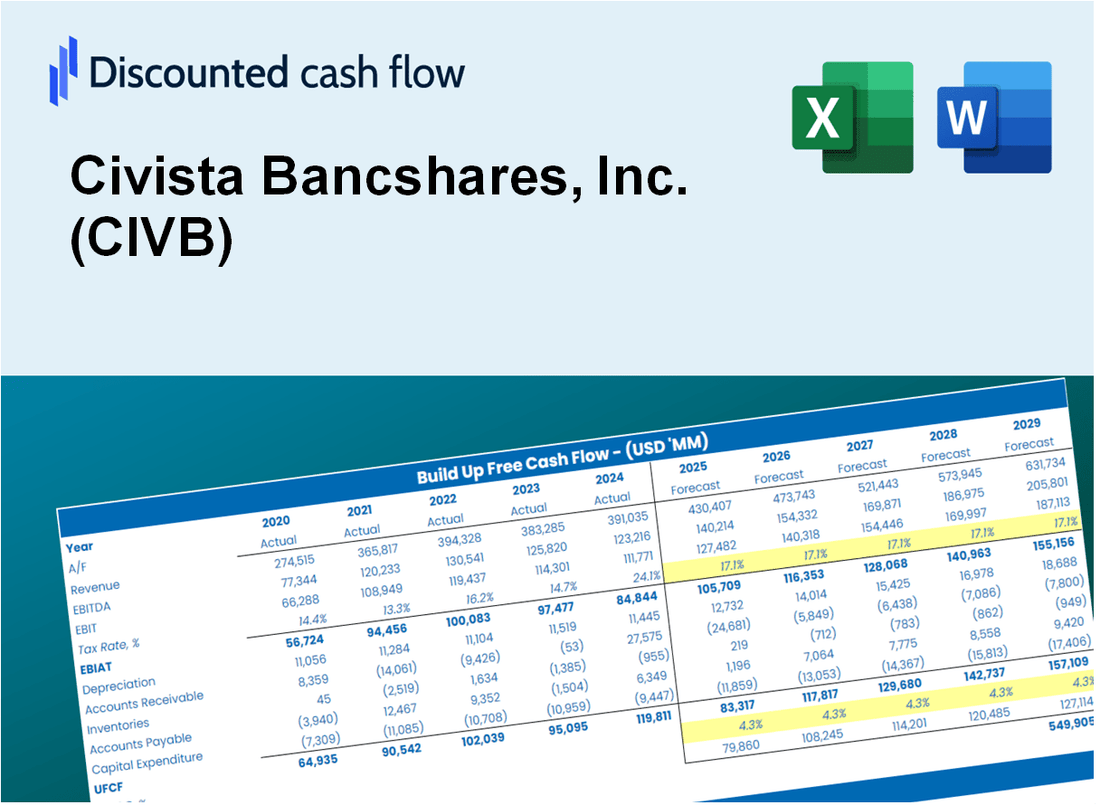
Discounted Cash Flow (DCF) - (USD MM)
| Year | AY1 2020 |
AY2 2021 |
AY3 2022 |
AY4 2023 |
AY5 2024 |
FY1 2025 |
FY2 2026 |
FY3 2027 |
FY4 2028 |
FY5 2029 |
|---|---|---|---|---|---|---|---|---|---|---|
| Revenue | 126.2 | 134.2 | 153.0 | 217.5 | 241.9 | 286.5 | 339.3 | 401.9 | 475.9 | 563.7 |
| Revenue Growth, % | 0 | 6.35 | 14 | 42.16 | 11.23 | 18.44 | 18.44 | 18.44 | 18.44 | 18.44 |
| EBITDA | 40.3 | 51.2 | 52.8 | 63.0 | 47.6 | 87.8 | 104.0 | 123.2 | 145.9 | 172.8 |
| EBITDA, % | 31.94 | 38.19 | 34.51 | 28.95 | 19.68 | 30.65 | 30.65 | 30.65 | 30.65 | 30.65 |
| Depreciation | 3.2 | 2.9 | 5.8 | 12.3 | 11.0 | 10.7 | 12.6 | 15.0 | 17.7 | 21.0 |
| Depreciation, % | 2.51 | 2.14 | 3.76 | 5.67 | 4.56 | 3.73 | 3.73 | 3.73 | 3.73 | 3.73 |
| EBIT | 37.1 | 48.4 | 47.0 | 50.6 | 36.6 | 77.1 | 91.4 | 108.2 | 128.1 | 151.8 |
| EBIT, % | 29.43 | 36.05 | 30.75 | 23.27 | 15.12 | 26.92 | 26.92 | 26.92 | 26.92 | 26.92 |
| Total Cash | 491.7 | 815.1 | 660.2 | 679.9 | 329.9 | 286.5 | 339.3 | 401.9 | 475.9 | 563.7 |
| Total Cash, percent | .0 | .0 | .0 | .0 | .0 | .0 | .0 | .0 | .0 | .0 |
| Account Receivables | 9.4 | 7.4 | 47.5 | 67.2 | 59.0 | 56.9 | 67.4 | 79.8 | 94.5 | 112.0 |
| Account Receivables, % | 7.47 | 5.5 | 31.08 | 30.88 | 24.39 | 19.86 | 19.86 | 19.86 | 19.86 | 19.86 |
| Inventories | .0 | .0 | .0 | .0 | .0 | .0 | .0 | .0 | .0 | .0 |
| Inventories, % | 0 | 0 | 0 | 0 | 0 | 0 | 0 | 0 | 0 | 0 |
| Accounts Payable | .0 | .0 | .0 | .0 | .0 | .0 | .0 | .0 | .0 | .0 |
| Accounts Payable, % | 0 | 0 | 0 | 0 | 0 | 0 | 0 | 0 | 0 | 0 |
| Capital Expenditure | -2.0 | -1.9 | -6.5 | -3.4 | -4.2 | -6.1 | -7.2 | -8.5 | -10.1 | -11.9 |
| Capital Expenditure, % | -1.56 | -1.44 | -4.25 | -1.58 | -1.73 | -2.11 | -2.11 | -2.11 | -2.11 | -2.11 |
| Tax Rate, % | 13.37 | 13.37 | 13.37 | 13.37 | 13.37 | 13.37 | 13.37 | 13.37 | 13.37 | 13.37 |
| EBITAT | 32.2 | 40.5 | 39.4 | 43.0 | 31.7 | 65.7 | 77.8 | 92.1 | 109.1 | 129.3 |
| Depreciation | ||||||||||
| Changes in Account Receivables | ||||||||||
| Changes in Inventories | ||||||||||
| Changes in Accounts Payable | ||||||||||
| Capital Expenditure | ||||||||||
| UFCF | 24.0 | 43.5 | -1.5 | 32.3 | 46.7 | 72.4 | 72.8 | 86.2 | 102.1 | 120.9 |
| WACC, % | 13.13 | 12.78 | 12.79 | 12.91 | 13.12 | 12.95 | 12.95 | 12.95 | 12.95 | 12.95 |
| PV UFCF | ||||||||||
| SUM PV UFCF | 309.6 | |||||||||
| Long Term Growth Rate, % | 2.00 | |||||||||
| Free cash flow (T + 1) | 123 | |||||||||
| Terminal Value | 1,127 | |||||||||
| Present Terminal Value | 613 | |||||||||
| Enterprise Value | 923 | |||||||||
| Net Debt | 386 | |||||||||
| Equity Value | 536 | |||||||||
| Diluted Shares Outstanding, MM | 15 | |||||||||
| Equity Value Per Share | 34.82 |
What You Will Get
- Real CIVB Financials: Access to historical and projected data for precise valuation.
- Customizable Inputs: Adjust WACC, tax rates, revenue growth, and capital expenditures as needed.
- Dynamic Calculations: Intrinsic value and NPV are computed in real-time.
- Scenario Analysis: Explore various scenarios to assess Civista Bancshares' future performance.
- User-Friendly Interface: Designed for professionals while remaining approachable for newcomers.
Key Features
- Comprehensive CIVB Financial Data: Pre-loaded with Civista Bancshares' historical performance metrics and future financial forecasts.
- Flexible Input Options: Modify key variables such as loan growth, interest margins, capital adequacy ratios, and operating expenses.
- Interactive Valuation Model: Real-time updates to Net Present Value (NPV) and intrinsic value based on your customized parameters.
- Multiple Scenario Analysis: Develop various forecasting scenarios to evaluate different valuation possibilities.
- Intuitive User Interface: Designed for ease of use, catering to both seasoned professionals and newcomers.
How It Works
- Step 1: Download the Excel file for Civista Bancshares, Inc. (CIVB).
- Step 2: Review the pre-filled financial data and forecasts for Civista Bancshares.
- Step 3: Adjust key inputs such as revenue growth, WACC, and tax rates (highlighted cells).
- Step 4: Observe the DCF model update in real-time as you modify your assumptions.
- Step 5: Analyze the results and leverage the findings for your investment strategies.
Why Choose This Calculator for Civista Bancshares, Inc. (CIVB)?
- Comprehensive Tool: Features DCF, WACC, and financial ratio analyses tailored for Civista Bancshares.
- Customizable Inputs: Modify yellow-highlighted cells to explore different financial scenarios.
- Detailed Insights: Automatically computes Civista’s intrinsic value and Net Present Value.
- Preloaded Data: Historical and projected data provide reliable starting points for analysis.
- Professional Quality: Perfect for financial analysts, investors, and business consultants focused on Civista Bancshares.
Who Should Use This Product?
- Finance Students: Explore banking fundamentals and apply them using real-world data from Civista Bancshares, Inc. (CIVB).
- Academics: Integrate contemporary banking models into your coursework or research projects.
- Investors: Evaluate your investment strategies and analyze the financial performance of Civista Bancshares, Inc. (CIVB).
- Analysts: Enhance your analysis with a customizable financial model tailored for Civista Bancshares, Inc. (CIVB).
- Small Business Owners: Understand how community banks like Civista Bancshares, Inc. (CIVB) assess financial health and performance.
What the Template Contains
- Operating and Balance Sheet Data: Pre-filled Civista Bancshares historical data and forecasts, including revenue, EBITDA, EBIT, and capital expenditures.
- WACC Calculation: A dedicated sheet for Weighted Average Cost of Capital (WACC), including parameters like Beta, risk-free rate, and share price.
- DCF Valuation (Unlevered and Levered): Editable Discounted Cash Flow models showing intrinsic value with detailed calculations.
- Financial Statements: Pre-loaded financial statements (annual and quarterly) to support analysis.
- Key Ratios: Includes profitability, leverage, and efficiency ratios for Civista Bancshares, Inc. (CIVB).
- Dashboard and Charts: Visual summary of valuation outputs and assumptions to analyze results easily.
Disclaimer
All information, articles, and product details provided on this website are for general informational and educational purposes only. We do not claim any ownership over, nor do we intend to infringe upon, any trademarks, copyrights, logos, brand names, or other intellectual property mentioned or depicted on this site. Such intellectual property remains the property of its respective owners, and any references here are made solely for identification or informational purposes, without implying any affiliation, endorsement, or partnership.
We make no representations or warranties, express or implied, regarding the accuracy, completeness, or suitability of any content or products presented. Nothing on this website should be construed as legal, tax, investment, financial, medical, or other professional advice. In addition, no part of this site—including articles or product references—constitutes a solicitation, recommendation, endorsement, advertisement, or offer to buy or sell any securities, franchises, or other financial instruments, particularly in jurisdictions where such activity would be unlawful.
All content is of a general nature and may not address the specific circumstances of any individual or entity. It is not a substitute for professional advice or services. Any actions you take based on the information provided here are strictly at your own risk. You accept full responsibility for any decisions or outcomes arising from your use of this website and agree to release us from any liability in connection with your use of, or reliance upon, the content or products found herein.