
|
Coca-Cola Consolidated, Inc. (Coke) DCF-Bewertung |
Fully Editable: Tailor To Your Needs In Excel Or Sheets
Professional Design: Trusted, Industry-Standard Templates
Investor-Approved Valuation Models
MAC/PC Compatible, Fully Unlocked
No Expertise Is Needed; Easy To Follow
Coca-Cola Consolidated, Inc. (COKE) Bundle
Bewerten Sie die finanziellen Aussichten von Coca-Cola Consolidated, Inc. (Coke) mit Fachwissen! Dieser (Coke) DCF-Taschenrechner bietet vorgefüllte Finanzdaten und die Flexibilität, um das Umsatzwachstum, WACC, Margen und andere wesentliche Annahmen zu ändern, um sich an Ihren Vorhersagen zu übereinstimmen.
What You Will Get
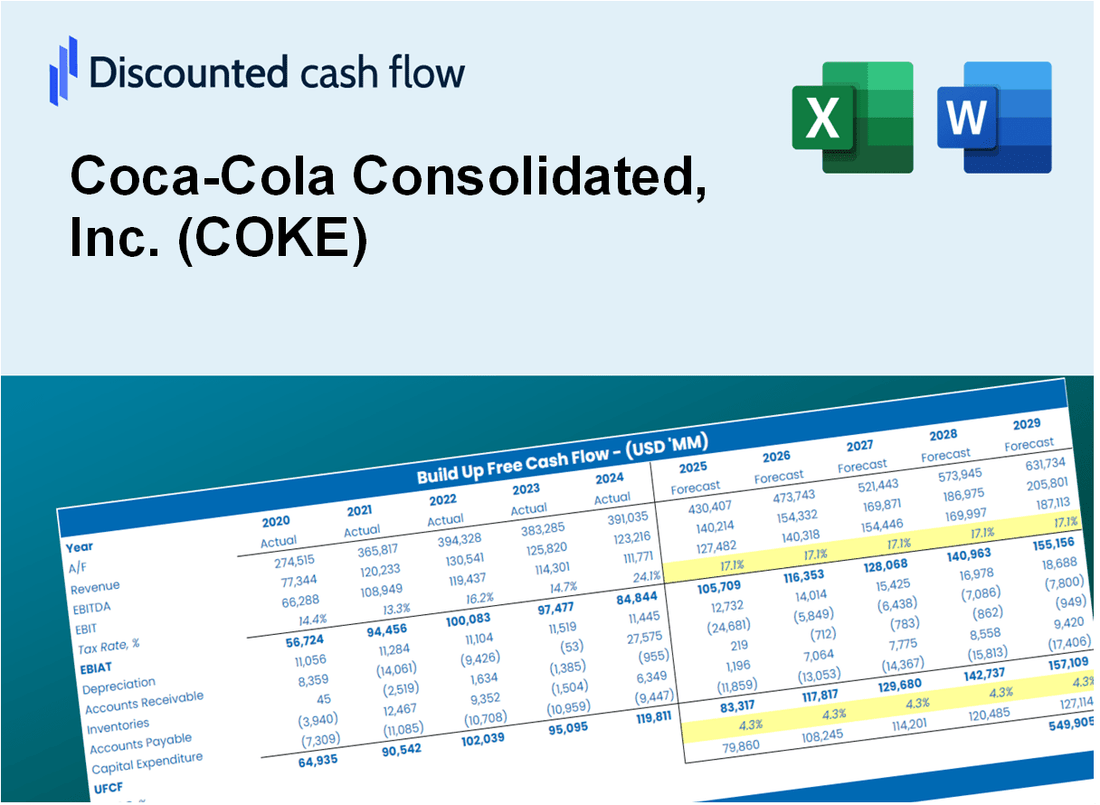
- Real COKE Financial Data: Pre-filled with Coca-Cola Consolidated’s historical and projected data for precise analysis.
- Fully Editable Template: Modify key inputs like revenue growth, WACC, and EBITDA % with ease.
- Automatic Calculations: See Coca-Cola Consolidated’s intrinsic value update instantly based on your changes.
- Professional Valuation Tool: Designed for investors, analysts, and consultants seeking accurate DCF results.
- User-Friendly Design: Simple structure and clear instructions for all experience levels.
Key Features
- Comprehensive DCF Calculator: Features detailed unlevered and levered DCF valuation models tailored for Coca-Cola Consolidated, Inc. (COKE).
- WACC Calculator: Comes with a pre-built Weighted Average Cost of Capital sheet that allows for customizable inputs.
- Adjustable Forecast Assumptions: Easily modify growth rates, capital expenditures, and discount rates to suit your analysis.
- Integrated Financial Ratios: Evaluate profitability, leverage, and efficiency ratios specifically for Coca-Cola Consolidated, Inc. (COKE).
- Interactive Dashboard and Charts: Visual representations provide a summary of key valuation metrics for straightforward analysis.
How It Works
- 1. Access the Template: Download and open the Excel file containing Coca-Cola Consolidated, Inc.'s (COKE) financial data.
- 2. Adjust Key Inputs: Modify essential variables such as sales growth, cost of goods sold, and operating expenses.
- 3. Analyze Results Immediately: The DCF model automatically
Why Choose Coca-Cola Consolidated, Inc. (COKE)?
- Rich Heritage: Benefit from a company with a long-standing reputation in the beverage industry.
- Quality Products: Enjoy a diverse range of beverages that meet high standards of taste and quality.
- Innovative Solutions: Experience cutting-edge marketing strategies and product offerings that resonate with consumers.
- Strong Community Engagement: Participate in initiatives that support local communities and sustainability.
- Proven Leadership: Trust in a management team with extensive experience and a commitment to excellence.
Who Should Use This Product?
- Individual Investors: Make informed decisions about buying or selling Coca-Cola Consolidated, Inc. (COKE) stock.
- Financial Analysts: Streamline valuation processes with ready-to-use financial models specifically for Coca-Cola Consolidated, Inc. (COKE).
- Consultants: Deliver professional valuation insights on Coca-Cola Consolidated, Inc. (COKE) to clients quickly and accurately.
- Business Owners: Understand how large beverage companies like Coca-Cola Consolidated, Inc. (COKE) are valued to guide your own strategy.
- Finance Students: Learn valuation techniques using real-world data and scenarios related to Coca-Cola Consolidated, Inc. (COKE).
What the Template Contains
- Comprehensive DCF Model: Editable template with detailed valuation calculations tailored for Coca-Cola Consolidated, Inc. (COKE).
- Real-World Data: Coca-Cola Consolidated’s historical and projected financials preloaded for thorough analysis.
- Customizable Parameters: Adjust WACC, growth rates, and tax assumptions to explore different scenarios.
- Financial Statements: Complete annual and quarterly breakdowns for enhanced insights.
- Key Ratios: Integrated analysis for profitability, efficiency, and leverage metrics.
- Dashboard with Visual Outputs: Charts and tables designed for clear, actionable results.
Disclaimer
All information, articles, and product details provided on this website are for general informational and educational purposes only. We do not claim any ownership over, nor do we intend to infringe upon, any trademarks, copyrights, logos, brand names, or other intellectual property mentioned or depicted on this site. Such intellectual property remains the property of its respective owners, and any references here are made solely for identification or informational purposes, without implying any affiliation, endorsement, or partnership.
We make no representations or warranties, express or implied, regarding the accuracy, completeness, or suitability of any content or products presented. Nothing on this website should be construed as legal, tax, investment, financial, medical, or other professional advice. In addition, no part of this site—including articles or product references—constitutes a solicitation, recommendation, endorsement, advertisement, or offer to buy or sell any securities, franchises, or other financial instruments, particularly in jurisdictions where such activity would be unlawful.
All content is of a general nature and may not address the specific circumstances of any individual or entity. It is not a substitute for professional advice or services. Any actions you take based on the information provided here are strictly at your own risk. You accept full responsibility for any decisions or outcomes arising from your use of this website and agree to release us from any liability in connection with your use of, or reliance upon, the content or products found herein.