
|
DiamondRock Hospitality Company (DRH) DCF -Bewertung |
Fully Editable: Tailor To Your Needs In Excel Or Sheets
Professional Design: Trusted, Industry-Standard Templates
Investor-Approved Valuation Models
MAC/PC Compatible, Fully Unlocked
No Expertise Is Needed; Easy To Follow
DiamondRock Hospitality Company (DRH) Bundle
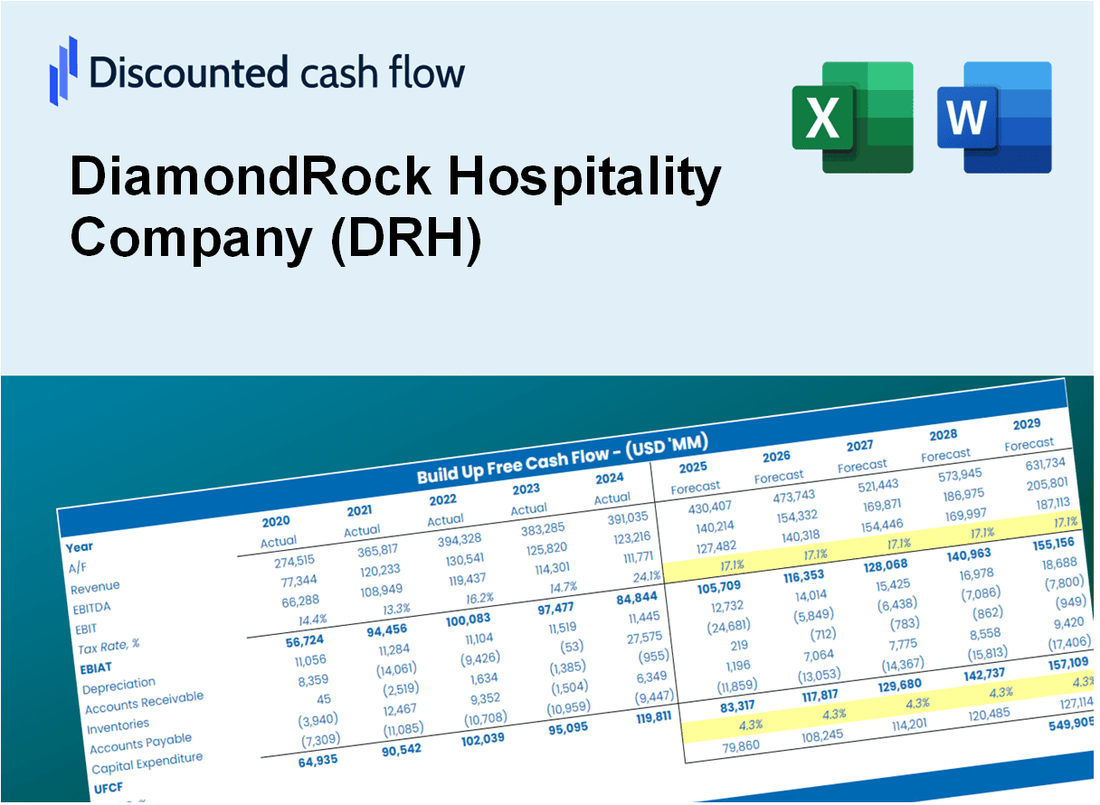
Gewinnen Sie einen Einblick in Ihre Bewertungsanalyse für DiamondRock Hospitality Company (DRH) mit unserem ausgefeilten DCF -Taschenrechner! Diese Excel -Vorlage wird mit realen (DRH-) Daten vorinstalliert, sodass Sie Prognosen und Annahmen anpassen können, um den inneren Wert des DiamondRock -Hospitality -Unternehmens genau zu bestimmen.
What You Will Get
- Real DRH Financials: Access to historical and projected data for precise valuation.
- Customizable Inputs: Adjust WACC, tax rates, revenue growth, and capital expenditures as needed.
- Dynamic Calculations: Intrinsic value and NPV are computed in real-time.
- Scenario Analysis: Explore various scenarios to assess DiamondRock's future performance.
- User-Friendly Design: Designed for industry professionals while remaining approachable for newcomers.
Key Features
- Comprehensive DCF Calculator: Features detailed unlevered and levered DCF valuation models tailored for DiamondRock Hospitality Company (DRH).
- WACC Calculator: Pre-configured Weighted Average Cost of Capital sheet with adjustable inputs specific to the hospitality sector.
- Customizable Forecast Assumptions: Adjust growth rates, capital expenditures, and discount rates to fit your analysis of DiamondRock Hospitality Company (DRH).
- Integrated Financial Ratios: Assess profitability, leverage, and efficiency ratios for DiamondRock Hospitality Company (DRH).
- Interactive Dashboard and Charts: Visual representations summarize essential valuation metrics for straightforward analysis.
How It Works
- Step 1: Download the Excel file.
- Step 2: Review DiamondRock Hospitality Company's (DRH) pre-filled financial data and forecasts.
- Step 3: Modify key inputs such as occupancy rates, average daily rates, and operating expenses (highlighted cells).
- Step 4: Observe the DCF model update in real-time as you adjust your assumptions.
- Step 5: Evaluate the outputs and leverage the results for your investment strategies.
Why Choose This Calculator for DiamondRock Hospitality Company (DRH)?
- Designed for Industry Leaders: A sophisticated tool tailored for real estate analysts, investors, and financial advisors.
- Comprehensive Data: DiamondRock's historical and projected financials are preloaded for enhanced accuracy.
- Flexible Scenario Analysis: Effortlessly simulate various market conditions and investment assumptions.
- Detailed Outputs: Automatically computes intrinsic value, NPV, and essential performance metrics.
- User-Friendly Interface: Clear, step-by-step guidance ensures a smooth experience.
Who Should Use This Product?
- Hospitality Students: Discover valuation methodologies and apply them using real-world data.
- Researchers: Integrate industry-specific models into academic studies or projects.
- Investors: Evaluate your own hypotheses and assess valuation results for DiamondRock Hospitality Company (DRH).
- Financial Analysts: Enhance your efficiency with a ready-to-use, customizable DCF model.
- Hotel Owners: Understand how major public hospitality firms like DiamondRock are valued in the market.
What the Template Contains
- Historical Data: Includes DiamondRock Hospitality Company’s (DRH) past financials and baseline forecasts.
- DCF and Levered DCF Models: Detailed templates to calculate DiamondRock Hospitality Company’s (DRH) intrinsic value.
- WACC Sheet: Pre-built calculations for Weighted Average Cost of Capital.
- Editable Inputs: Modify key drivers like occupancy rates, revenue per available room (RevPAR), and capital expenditure (CAPEX) assumptions.
- Quarterly and Annual Statements: A complete breakdown of DiamondRock Hospitality Company’s (DRH) financials.
- Interactive Dashboard: Visualize valuation results and projections dynamically.
Disclaimer
All information, articles, and product details provided on this website are for general informational and educational purposes only. We do not claim any ownership over, nor do we intend to infringe upon, any trademarks, copyrights, logos, brand names, or other intellectual property mentioned or depicted on this site. Such intellectual property remains the property of its respective owners, and any references here are made solely for identification or informational purposes, without implying any affiliation, endorsement, or partnership.
We make no representations or warranties, express or implied, regarding the accuracy, completeness, or suitability of any content or products presented. Nothing on this website should be construed as legal, tax, investment, financial, medical, or other professional advice. In addition, no part of this site—including articles or product references—constitutes a solicitation, recommendation, endorsement, advertisement, or offer to buy or sell any securities, franchises, or other financial instruments, particularly in jurisdictions where such activity would be unlawful.
All content is of a general nature and may not address the specific circumstances of any individual or entity. It is not a substitute for professional advice or services. Any actions you take based on the information provided here are strictly at your own risk. You accept full responsibility for any decisions or outcomes arising from your use of this website and agree to release us from any liability in connection with your use of, or reliance upon, the content or products found herein.