
|
Eventbrite, Inc. (EB) DCF -Bewertung |
Fully Editable: Tailor To Your Needs In Excel Or Sheets
Professional Design: Trusted, Industry-Standard Templates
Investor-Approved Valuation Models
MAC/PC Compatible, Fully Unlocked
No Expertise Is Needed; Easy To Follow
Eventbrite, Inc. (EB) Bundle
Entdecken Sie das wahre Potenzial von EventBrite, Inc. (EB) mit unserem fortschrittlichen DCF -Taschenrechner! Passen Sie die wichtigsten Annahmen an, erkunden Sie verschiedene Szenarien und untersuchen, wie Veränderungen Eventbrite, Inc. (EB) bewerten - alles innerhalb einer umfassenden Excel -Vorlage.
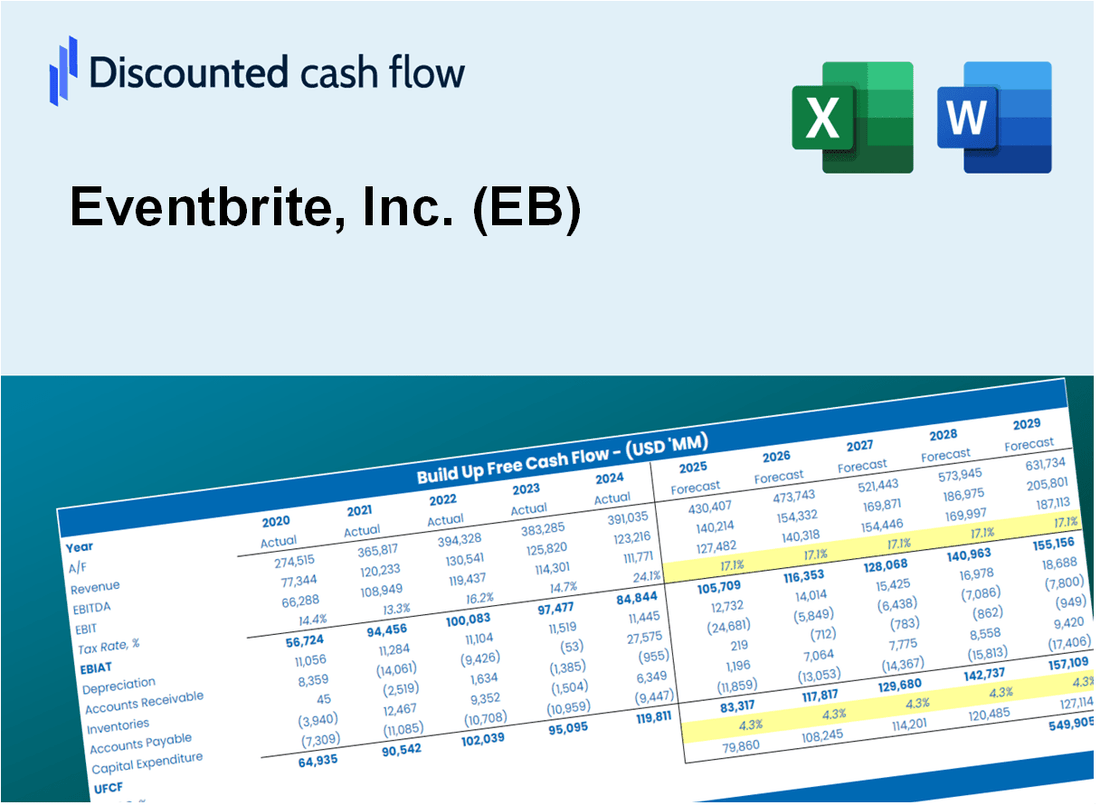
Discounted Cash Flow (DCF) - (USD MM)
| Year | AY1 2020 |
AY2 2021 |
AY3 2022 |
AY4 2023 |
AY5 2024 |
FY1 2025 |
FY2 2026 |
FY3 2027 |
FY4 2028 |
FY5 2029 |
|---|---|---|---|---|---|---|---|---|---|---|
| Revenue | 106.0 | 187.1 | 260.9 | 326.1 | 325.1 | 439.4 | 593.8 | 802.6 | 1,084.8 | 1,466.1 |
| Revenue Growth, % | 0 | 76.53 | 39.43 | 24.99 | -0.32686 | 35.16 | 35.16 | 35.16 | 35.16 | 35.16 |
| EBITDA | -169.0 | -99.9 | -27.9 | 1.4 | 11.7 | -140.6 | -190.1 | -256.9 | -347.2 | -469.3 |
| EBITDA, % | -159.47 | -53.36 | -10.71 | 0.44062 | 3.59 | -32.01 | -32.01 | -32.01 | -32.01 | -32.01 |
| Depreciation | 31.2 | 21.5 | 16.0 | 14.7 | 16.3 | 49.7 | 67.2 | 90.8 | 122.8 | 165.9 |
| Depreciation, % | 29.4 | 11.51 | 6.15 | 4.52 | 5.01 | 11.32 | 11.32 | 11.32 | 11.32 | 11.32 |
| EBIT | -200.2 | -121.4 | -44.0 | -13.3 | -4.6 | -164.5 | -222.4 | -300.5 | -406.2 | -549.0 |
| EBIT, % | -188.87 | -64.87 | -16.86 | -4.08 | -1.42 | -37.44 | -37.44 | -37.44 | -37.44 | -37.44 |
| Total Cash | 505.8 | 634.4 | 623.5 | 642.9 | 441.5 | 439.4 | 593.8 | 802.6 | 1,084.8 | 1,466.1 |
| Total Cash, percent | .0 | .0 | .0 | .0 | .0 | .0 | .0 | .0 | .0 | .0 |
| Account Receivables | 10.8 | 3.2 | 3.6 | 51.6 | 5.6 | 27.0 | 36.5 | 49.4 | 66.7 | 90.2 |
| Account Receivables, % | 10.16 | 1.69 | 1.39 | 15.82 | 1.71 | 6.15 | 6.15 | 6.15 | 6.15 | 6.15 |
| Inventories | 16.5 | 18.7 | .7 | .0 | .0 | 22.7 | 30.7 | 41.4 | 56.0 | 75.7 |
| Inventories, % | 15.52 | 10.01 | 0.27632 | 0 | 0 | 5.16 | 5.16 | 5.16 | 5.16 | 5.16 |
| Accounts Payable | 193.0 | 286.3 | 310.3 | 305.3 | 301.6 | 427.4 | 577.6 | 780.7 | 1,055.2 | 1,426.2 |
| Accounts Payable, % | 182.1 | 152.99 | 118.94 | 93.6 | 92.77 | 97.27 | 97.27 | 97.27 | 97.27 | 97.27 |
| Capital Expenditure | -6.3 | -2.5 | -4.5 | -7.2 | -.6 | -10.0 | -13.5 | -18.2 | -24.7 | -33.3 |
| Capital Expenditure, % | -5.93 | -1.35 | -1.71 | -2.2 | -0.18458 | -2.27 | -2.27 | -2.27 | -2.27 | -2.27 |
| Tax Rate, % | -16.1 | -16.1 | -16.1 | -16.1 | -16.1 | -16.1 | -16.1 | -16.1 | -16.1 | -16.1 |
| EBITAT | -200.1 | -122.6 | -44.1 | -14.4 | -5.4 | -164.5 | -222.3 | -300.5 | -406.2 | -548.9 |
| Depreciation | ||||||||||
| Changes in Account Receivables | ||||||||||
| Changes in Inventories | ||||||||||
| Changes in Accounts Payable | ||||||||||
| Capital Expenditure | ||||||||||
| UFCF | -9.4 | -5.1 | 9.1 | -59.1 | 52.7 | -43.1 | -35.9 | -48.5 | -65.5 | -88.5 |
| WACC, % | 8.11 | 8.11 | 8.11 | 8.11 | 8.11 | 8.11 | 8.11 | 8.11 | 8.11 | 8.11 |
| PV UFCF | ||||||||||
| SUM PV UFCF | -216.8 | |||||||||
| Long Term Growth Rate, % | 4.00 | |||||||||
| Free cash flow (T + 1) | -92 | |||||||||
| Terminal Value | -2,241 | |||||||||
| Present Terminal Value | -1,518 | |||||||||
| Enterprise Value | -1,735 | |||||||||
| Net Debt | -173 | |||||||||
| Equity Value | -1,561 | |||||||||
| Diluted Shares Outstanding, MM | 93 | |||||||||
| Equity Value Per Share | -16.78 |
What You Will Get
- Pre-Filled Financial Model: Eventbrite’s actual data allows for accurate DCF valuation.
- Full Forecast Control: Modify ticket sales growth, margins, WACC, and other essential drivers.
- Instant Calculations: Automatic updates provide immediate results as you make adjustments.
- Investor-Ready Template: A polished Excel file crafted for professional-level valuation.
- Customizable and Reusable: Designed for versatility, enabling repeated use for comprehensive forecasts.
Key Features
- Comprehensive Event Data: Gain access to detailed historical performance metrics and future event projections.
- Adjustable Revenue Assumptions: Modify highlighted fields for ticket pricing, growth rates, and market trends.
- Automated Analytics: Instant updates to revenue forecasts, profitability analysis, and customer engagement metrics.
- User-Friendly Interface: Intuitive dashboards and visualizations to easily interpret your event performance insights.
- Suitable for All Skill Levels: Designed for event planners, marketers, and analysts, providing a straightforward and accessible format.
How It Works
- Download: Get the ready-to-use Excel file featuring Eventbrite, Inc.'s (EB) financial data.
- Customize: Modify forecasts, including ticket sales growth, EBITDA %, and WACC.
- Update Automatically: The intrinsic value and NPV calculations refresh in real-time.
- Test Scenarios: Develop multiple projections and instantly compare the results.
- Make Decisions: Utilize the valuation outcomes to inform your investment strategy.
Why Choose This Calculator?
- Designed for Professionals: A sophisticated tool utilized by event planners, analysts, and financial consultants.
- Comprehensive Data: Eventbrite’s historical and projected financials preloaded for precise analysis.
- Scenario Analysis: Effortlessly simulate various event outcomes and financial assumptions.
- Transparent Results: Automatically calculates intrinsic value, NPV, and essential metrics.
- User-Friendly: Step-by-step guidance to assist you throughout the calculation process.
Who Should Use This Product?
- Event Organizers: Assess Eventbrite’s market position before planning events.
- Financial Analysts: Optimize evaluation methods and validate revenue forecasts.
- Entrepreneurs: Understand how leading event management companies like Eventbrite are valued.
- Consultants: Create detailed valuation reports for clients in the events industry.
- Students and Educators: Utilize current data to learn and teach valuation strategies.
What the Template Contains
- Pre-Filled Data: Includes Eventbrite’s historical financials and forecasts.
- Discounted Cash Flow Model: Editable DCF valuation model with automatic calculations.
- Weighted Average Cost of Capital (WACC): A dedicated sheet for calculating WACC based on custom inputs.
- Key Financial Ratios: Analyze Eventbrite’s profitability, efficiency, and leverage.
- Customizable Inputs: Edit revenue growth, margins, and tax rates with ease.
- Clear Dashboard: Charts and tables summarizing key valuation results.
Disclaimer
All information, articles, and product details provided on this website are for general informational and educational purposes only. We do not claim any ownership over, nor do we intend to infringe upon, any trademarks, copyrights, logos, brand names, or other intellectual property mentioned or depicted on this site. Such intellectual property remains the property of its respective owners, and any references here are made solely for identification or informational purposes, without implying any affiliation, endorsement, or partnership.
We make no representations or warranties, express or implied, regarding the accuracy, completeness, or suitability of any content or products presented. Nothing on this website should be construed as legal, tax, investment, financial, medical, or other professional advice. In addition, no part of this site—including articles or product references—constitutes a solicitation, recommendation, endorsement, advertisement, or offer to buy or sell any securities, franchises, or other financial instruments, particularly in jurisdictions where such activity would be unlawful.
All content is of a general nature and may not address the specific circumstances of any individual or entity. It is not a substitute for professional advice or services. Any actions you take based on the information provided here are strictly at your own risk. You accept full responsibility for any decisions or outcomes arising from your use of this website and agree to release us from any liability in connection with your use of, or reliance upon, the content or products found herein.