
|
Farmers National Banc Corp. (FMNB) DCF -Bewertung |
Fully Editable: Tailor To Your Needs In Excel Or Sheets
Professional Design: Trusted, Industry-Standard Templates
Investor-Approved Valuation Models
MAC/PC Compatible, Fully Unlocked
No Expertise Is Needed; Easy To Follow
Farmers National Banc Corp. (FMNB) Bundle
Unabhängig davon, ob Sie ein Investor oder Analyst sind, ist dieser (FMNB) DCF-Taschenrechner Ihre Anlaufstelle für eine genaue Bewertung. Mit realen Daten von Farmers National Banc Corp. können Sie Prognosen anpassen und die Auswirkungen sofort beobachten.
What You Will Get
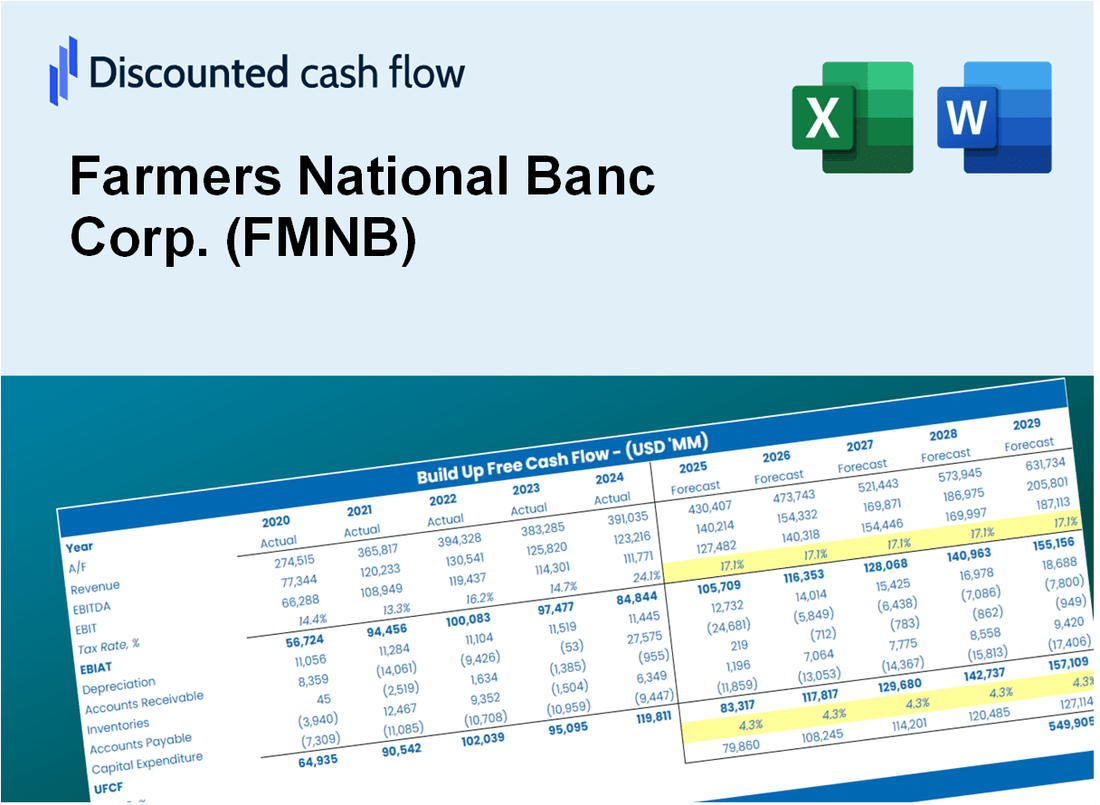
- Real FMNB Financial Data: Pre-filled with Farmers National Banc Corp.'s historical and projected data for precise analysis.
- Fully Editable Template: Modify key inputs like revenue growth, WACC, and EBITDA % with ease.
- Automatic Calculations: See FMNB's intrinsic value update instantly based on your changes.
- Professional Valuation Tool: Designed for investors, analysts, and consultants seeking accurate DCF results.
- User-Friendly Design: Simple structure and clear instructions for all experience levels.
Key Features
- Comprehensive DCF Calculator: Features detailed unlevered and levered DCF valuation models tailored for Farmers National Banc Corp. (FMNB).
- WACC Calculator: Pre-configured Weighted Average Cost of Capital sheet with adjustable inputs specific to FMNB.
- Customizable Forecast Assumptions: Adjust growth rates, capital expenditures, and discount rates to fit FMNB's financial outlook.
- Integrated Financial Ratios: Evaluate profitability, leverage, and efficiency ratios relevant to Farmers National Banc Corp. (FMNB).
- Interactive Dashboard and Charts: Visual representations summarize essential valuation metrics for straightforward analysis of FMNB.
How It Works
- Step 1: Download the Excel file for Farmers National Banc Corp. (FMNB).
- Step 2: Review the pre-filled financial data and forecasts for Farmers National Banc Corp. (FMNB).
- Step 3: Adjust key inputs such as revenue growth, WACC, and tax rates (highlighted cells) for Farmers National Banc Corp. (FMNB).
- Step 4: Observe the DCF model update in real-time as you modify your assumptions for Farmers National Banc Corp. (FMNB).
- Step 5: Evaluate the outputs and leverage the results for your investment decisions regarding Farmers National Banc Corp. (FMNB).
Why Choose This Calculator for Farmers National Banc Corp. (FMNB)?
- Accurate Data: Utilize real Farmers National Banc Corp. financials for trustworthy valuation outcomes.
- Customizable: Modify essential parameters such as growth rates, WACC, and tax rates to align with your forecasts.
- Time-Saving: Pre-configured calculations save you from starting from the ground up.
- Professional-Grade Tool: Tailored for investors, analysts, and financial consultants.
- User-Friendly: Easy-to-navigate design and step-by-step guidance ensure accessibility for all users.
Who Should Use Farmers National Banc Corp. (FMNB)?
- Investors: Leverage a reliable banking institution for your financial growth and stability.
- Financial Analysts: Utilize comprehensive reports and insights to enhance your market analysis.
- Small Business Owners: Access tailored banking solutions designed to support your business needs.
- Community Members: Engage with a bank that prioritizes local investment and development.
- Students and Educators: Explore banking fundamentals and financial literacy through practical resources.
What the Template Contains
- Comprehensive DCF Model: Editable template with detailed valuation calculations for Farmers National Banc Corp. (FMNB).
- Real-World Data: Farmers National Banc Corp.'s historical and projected financials preloaded for analysis.
- Customizable Parameters: Adjust WACC, growth rates, and tax assumptions to test various scenarios for Farmers National Banc Corp. (FMNB).
- Financial Statements: Full annual and quarterly breakdowns for deeper insights into Farmers National Banc Corp. (FMNB).
- Key Ratios: Built-in analysis for profitability, efficiency, and leverage relevant to Farmers National Banc Corp. (FMNB).
- Dashboard with Visual Outputs: Charts and tables for clear, actionable results for Farmers National Banc Corp. (FMNB).
Disclaimer
All information, articles, and product details provided on this website are for general informational and educational purposes only. We do not claim any ownership over, nor do we intend to infringe upon, any trademarks, copyrights, logos, brand names, or other intellectual property mentioned or depicted on this site. Such intellectual property remains the property of its respective owners, and any references here are made solely for identification or informational purposes, without implying any affiliation, endorsement, or partnership.
We make no representations or warranties, express or implied, regarding the accuracy, completeness, or suitability of any content or products presented. Nothing on this website should be construed as legal, tax, investment, financial, medical, or other professional advice. In addition, no part of this site—including articles or product references—constitutes a solicitation, recommendation, endorsement, advertisement, or offer to buy or sell any securities, franchises, or other financial instruments, particularly in jurisdictions where such activity would be unlawful.
All content is of a general nature and may not address the specific circumstances of any individual or entity. It is not a substitute for professional advice or services. Any actions you take based on the information provided here are strictly at your own risk. You accept full responsibility for any decisions or outcomes arising from your use of this website and agree to release us from any liability in connection with your use of, or reliance upon, the content or products found herein.