
|
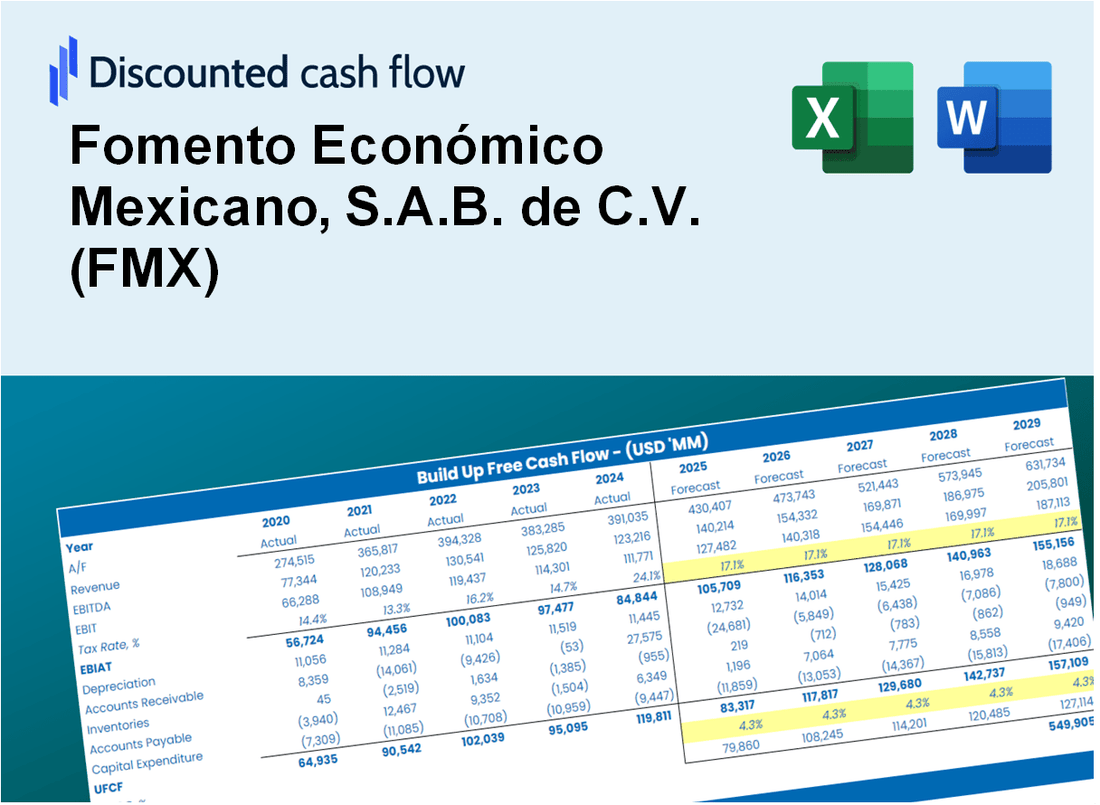
Fomento Económico Mexicano, S.A.B. de C.V. (FMX) DCF -Bewertung |
Fully Editable: Tailor To Your Needs In Excel Or Sheets
Professional Design: Trusted, Industry-Standard Templates
Investor-Approved Valuation Models
MAC/PC Compatible, Fully Unlocked
No Expertise Is Needed; Easy To Follow
Fomento Económico Mexicano, S.A.B. de C.V. (FMX) Bundle
Entdecken Sie den wahren Wert von Fomento Económico Mexicano, S.A.B. de C.V. (FMX) mit unserem fortschrittlichen DCF -Taschenrechner! Passen Sie wesentliche Annahmen an, erkunden Sie verschiedene Szenarien und bewerten Sie, wie unterschiedliche Faktoren die Bewertung von Fomento Económico Mexicano, S.A.B. de C.V. (FMX) - Alles innerhalb einer umfassenden Excel -Vorlage.
What You Will Receive
- Comprehensive Financial Model: FMX’s actual data facilitates accurate DCF valuation.
- Full Forecast Customization: Modify revenue growth, margins, WACC, and other essential factors.
- Real-Time Calculations: Automatic updates provide immediate results as you adjust parameters.
- Professional-Grade Template: A polished Excel file crafted for high-quality valuation.
- Flexible and Reusable: Designed for adaptability, allowing for repeated use in detailed forecasts.
Key Features
- 🔍 Real-Life FMX Financials: Pre-filled historical and projected data for Fomento Económico Mexicano, S.A.B. de C.V. (FMX).
- ✏️ Fully Customizable Inputs: Adjust all critical parameters (yellow cells) like WACC, growth %, and tax rates.
- 📊 Professional DCF Valuation: Built-in formulas calculate FMX’s intrinsic value using the Discounted Cash Flow method.
- ⚡ Instant Results: Visualize FMX’s valuation instantly after making changes.
- Scenario Analysis: Test and compare outcomes for various financial assumptions side-by-side.
How It Works
- Download: Get the comprehensive Excel file featuring Fomento Económico Mexicano, S.A.B. de C.V.'s (FMX) financial data.
- Customize: Tailor your forecasts, such as revenue growth, EBITDA %, and WACC, to fit your analysis.
- Update Automatically: Watch as the intrinsic value and NPV calculations refresh in real-time.
- Test Scenarios: Generate various projections and evaluate results instantly.
- Make Decisions: Leverage the valuation insights to inform your investment strategy.
Why Choose FMX's Calculator?
- Save Time: Eliminate the hassle of building a DCF model from the ground up – it’s ready for immediate use.
- Enhance Accuracy: Dependable financial data and formulas minimize valuation errors.
- Completely Customizable: Adjust the model to align with your unique assumptions and forecasts.
- User-Friendly: Intuitive charts and outputs simplify result analysis.
- Endorsed by Professionals: Crafted for experts who prioritize accuracy and functionality.
Who Should Use This Product?
- Individual Investors: Gain insights to make informed decisions about investing in Fomento Económico Mexicano, S.A.B. de C.V. (FMX).
- Financial Analysts: Enhance valuation processes with comprehensive financial models tailored for FMX.
- Consultants: Provide accurate and timely valuation insights related to FMX for your clients.
- Business Owners: Learn how large corporations like FMX are valued to inform your own business strategies.
- Finance Students: Acquire practical valuation skills using real-world data from FMX.
What the Template Contains
- Pre-Filled DCF Model: Fomento Económico Mexicano’s financial data preloaded for immediate use.
- WACC Calculator: Detailed calculations for Weighted Average Cost of Capital.
- Financial Ratios: Evaluate FMX’s profitability, leverage, and efficiency.
- Editable Inputs: Change assumptions such as growth, margins, and CAPEX to fit your scenarios.
- Financial Statements: Annual and quarterly reports to support detailed analysis.
- Interactive Dashboard: Easily visualize key valuation metrics and results.
Disclaimer
All information, articles, and product details provided on this website are for general informational and educational purposes only. We do not claim any ownership over, nor do we intend to infringe upon, any trademarks, copyrights, logos, brand names, or other intellectual property mentioned or depicted on this site. Such intellectual property remains the property of its respective owners, and any references here are made solely for identification or informational purposes, without implying any affiliation, endorsement, or partnership.
We make no representations or warranties, express or implied, regarding the accuracy, completeness, or suitability of any content or products presented. Nothing on this website should be construed as legal, tax, investment, financial, medical, or other professional advice. In addition, no part of this site—including articles or product references—constitutes a solicitation, recommendation, endorsement, advertisement, or offer to buy or sell any securities, franchises, or other financial instruments, particularly in jurisdictions where such activity would be unlawful.
All content is of a general nature and may not address the specific circumstances of any individual or entity. It is not a substitute for professional advice or services. Any actions you take based on the information provided here are strictly at your own risk. You accept full responsibility for any decisions or outcomes arising from your use of this website and agree to release us from any liability in connection with your use of, or reliance upon, the content or products found herein.