
|
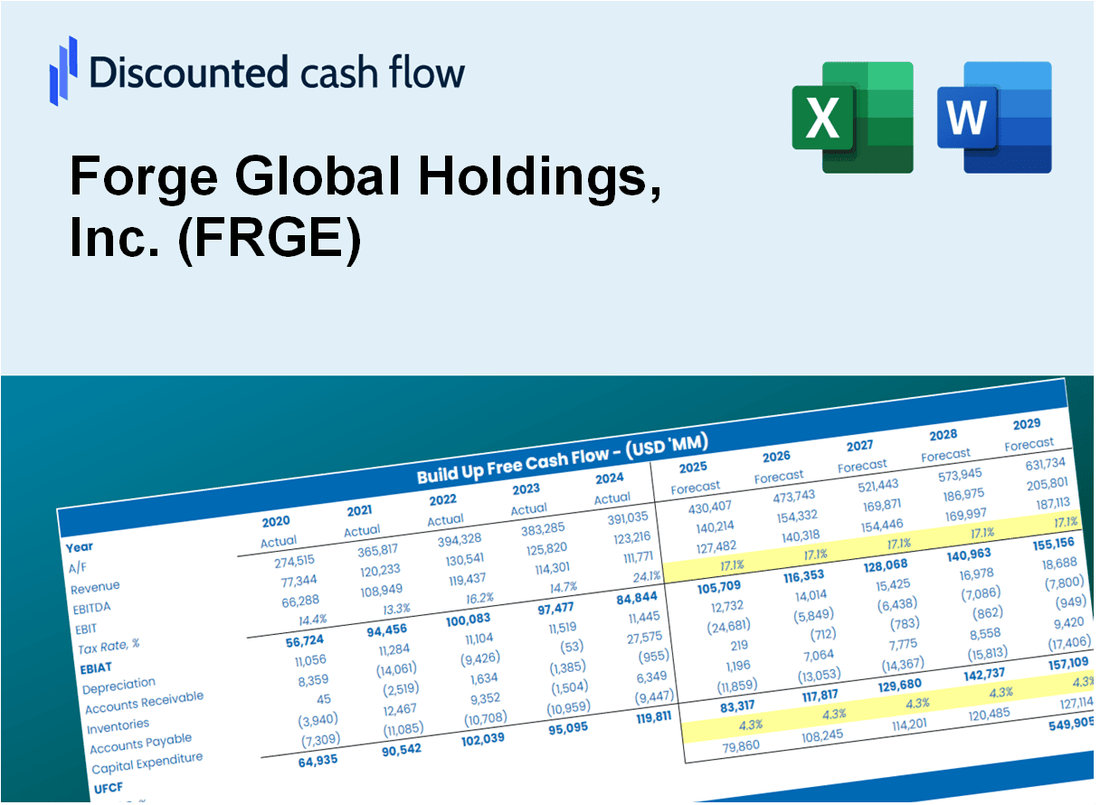
Forge Global Holdings, Inc. (FRGE) DCF -Bewertung |
Fully Editable: Tailor To Your Needs In Excel Or Sheets
Professional Design: Trusted, Industry-Standard Templates
Investor-Approved Valuation Models
MAC/PC Compatible, Fully Unlocked
No Expertise Is Needed; Easy To Follow
Forge Global Holdings, Inc. (FRGE) Bundle
Unabhängig davon, ob Sie ein Investor oder Analyst sind, ist dieser [Symbol] DCF-Taschenrechner Ihre Anlaufstelle für eine genaue Bewertung. Mit realen Daten von Forge Global Holdings, Inc. geladen, können Sie Prognosen anpassen und die Auswirkungen in Echtzeit beobachten.
What You Will Get
- Real FRGE Financial Data: Pre-filled with Forge Global Holdings’ historical and projected data for precise analysis.
- Fully Editable Template: Modify key inputs like revenue growth, WACC, and EBITDA % with ease.
- Automatic Calculations: See Forge Global Holdings’ intrinsic value update instantly based on your changes.
- Professional Valuation Tool: Designed for investors, analysts, and consultants seeking accurate DCF results.
- User-Friendly Design: Simple structure and clear instructions for all experience levels.
Key Features
- Customizable Investment Metrics: Adjust essential inputs such as market growth rates, profit margins, and operational expenses.
- Instant DCF Valuation: Quickly computes intrinsic value, NPV, and additional financial metrics.
- High-Precision Analysis: Leverages Forge Global Holdings' (FRGE) real-world data for accurate valuation results.
- Effortless Scenario Testing: Experiment with various assumptions and easily compare results.
- Efficiency Booster: Streamline the valuation process without the hassle of creating intricate models from the ground up.
How It Functions
- Download the Template: Gain immediate access to the Excel-based FRGE DCF Calculator.
- Input Your Assumptions: Modify the yellow-highlighted cells for growth rates, WACC, margins, and other variables.
- Instant Calculations: The model automatically recalculates the intrinsic value of Forge Global Holdings.
- Test Scenarios: Experiment with different assumptions to assess potential changes in valuation.
- Analyze and Decide: Leverage the results to inform your investment or financial assessments.
Why Choose This Calculator for Forge Global Holdings, Inc. (FRGE)?
- Accurate Data: Utilize real Forge Global financials for dependable valuation outcomes.
- Customizable: Modify essential parameters such as growth rates, WACC, and tax rates to align with your forecasts.
- Time-Saving: Pre-configured calculations save you the hassle of starting from the ground up.
- Professional-Grade Tool: Tailored for investors, analysts, and consultants in the financial sector.
- User-Friendly: An intuitive design and clear, step-by-step guidance make it accessible for all users.
Who Should Use This Product?
- Investors: Accurately assess Forge Global Holdings, Inc.’s (FRGE) fair value prior to making investment choices.
- CFOs: Utilize a high-quality DCF model for financial reporting and analysis specific to Forge Global Holdings, Inc. (FRGE).
- Consultants: Efficiently modify the template for valuation reports tailored to clients interested in Forge Global Holdings, Inc. (FRGE).
- Entrepreneurs: Understand financial modeling practices employed by leading companies, including Forge Global Holdings, Inc. (FRGE).
- Educators: Implement it as a teaching resource to illustrate valuation techniques relevant to Forge Global Holdings, Inc. (FRGE).
What the Template Contains
- Historical Data: Includes Forge Global Holdings, Inc.'s (FRGE) past financials and baseline forecasts.
- DCF and Levered DCF Models: Detailed templates to calculate Forge Global Holdings, Inc.'s (FRGE) intrinsic value.
- WACC Sheet: Pre-built calculations for Weighted Average Cost of Capital for Forge Global Holdings, Inc. (FRGE).
- Editable Inputs: Modify key drivers like growth rates, EBITDA %, and CAPEX assumptions specific to Forge Global Holdings, Inc. (FRGE).
- Quarterly and Annual Statements: A complete breakdown of Forge Global Holdings, Inc.'s (FRGE) financials.
- Interactive Dashboard: Visualize valuation results and projections for Forge Global Holdings, Inc. (FRGE) dynamically.
Disclaimer
All information, articles, and product details provided on this website are for general informational and educational purposes only. We do not claim any ownership over, nor do we intend to infringe upon, any trademarks, copyrights, logos, brand names, or other intellectual property mentioned or depicted on this site. Such intellectual property remains the property of its respective owners, and any references here are made solely for identification or informational purposes, without implying any affiliation, endorsement, or partnership.
We make no representations or warranties, express or implied, regarding the accuracy, completeness, or suitability of any content or products presented. Nothing on this website should be construed as legal, tax, investment, financial, medical, or other professional advice. In addition, no part of this site—including articles or product references—constitutes a solicitation, recommendation, endorsement, advertisement, or offer to buy or sell any securities, franchises, or other financial instruments, particularly in jurisdictions where such activity would be unlawful.
All content is of a general nature and may not address the specific circumstances of any individual or entity. It is not a substitute for professional advice or services. Any actions you take based on the information provided here are strictly at your own risk. You accept full responsibility for any decisions or outcomes arising from your use of this website and agree to release us from any liability in connection with your use of, or reliance upon, the content or products found herein.