
|
FS KKR Capital Corp. (FSK) DCF -Bewertung |
Fully Editable: Tailor To Your Needs In Excel Or Sheets
Professional Design: Trusted, Industry-Standard Templates
Investor-Approved Valuation Models
MAC/PC Compatible, Fully Unlocked
No Expertise Is Needed; Easy To Follow
FS KKR Capital Corp. (FSK) Bundle
Optimieren Sie Ihre Analyse und verbessern Sie die Präzision mit unserem (FSK) DCF -Taschenrechner! Mit echten Daten von FS KKR Capital Corp. und anpassbaren Annahmen ermöglichen dieses Tool Sie, genau wie ein erfahrener Investor prognostiziert, analysieren und bewerten (FSK).
What You Will Get
- Editable Forecast Inputs: Easily modify assumptions (growth %, margins, WACC) to explore various scenarios.
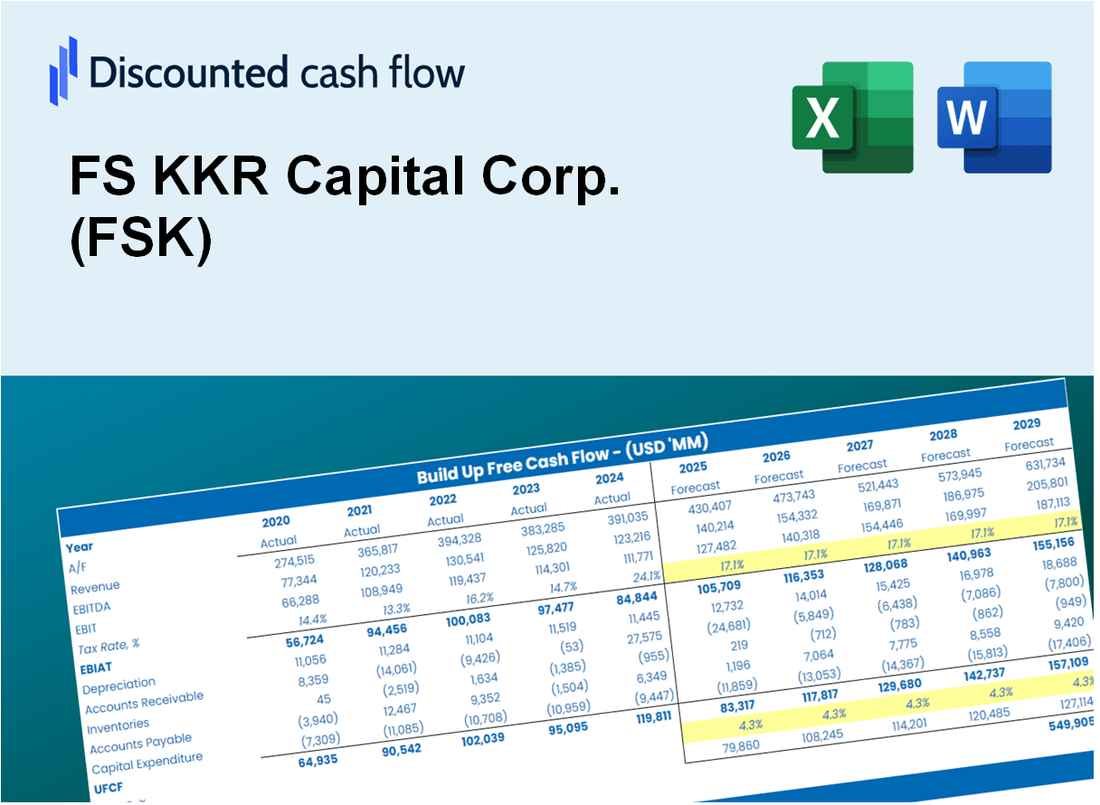
- Real-World Data: FS KKR Capital Corp. (FSK) financial data pre-filled to kickstart your analysis.
- Automatic DCF Outputs: The template computes Net Present Value (NPV) and intrinsic value for you.
- Customizable and Professional: A refined Excel model that adjusts to your valuation requirements.
- Built for Analysts and Investors: Perfect for testing projections, validating strategies, and enhancing efficiency.
Key Features
- 🔍 Real-Life FSK Financials: Pre-filled historical and projected data for FS KKR Capital Corp. (FSK).
- ✏️ Fully Customizable Inputs: Adjust all critical parameters (yellow cells) like WACC, growth %, and tax rates.
- 📊 Professional DCF Valuation: Built-in formulas calculate FSK’s intrinsic value using the Discounted Cash Flow method.
- ⚡ Instant Results: Visualize FSK’s valuation instantly after making changes.
- Scenario Analysis: Test and compare outcomes for various financial assumptions side-by-side.
How It Works
- Download: Obtain the pre-configured Excel file containing FS KKR Capital Corp.'s (FSK) financial data.
- Customize: Modify forecasts, including revenue growth, EBITDA %, and WACC to fit your analysis.
- Update Automatically: Watch as the intrinsic value and NPV calculations refresh in real-time.
- Test Scenarios: Develop multiple projections and instantly compare the results.
- Make Decisions: Leverage the valuation outcomes to inform your investment strategy.
Why Choose This Calculator for FS KKR Capital Corp. (FSK)?
- Designed for Experts: A sophisticated tool tailored for analysts, CFOs, and financial consultants.
- Accurate Financial Data: FS KKR's historical and projected financials are preloaded for precision.
- Flexible Scenario Analysis: Effortlessly test various forecasts and assumptions.
- Comprehensive Outputs: Automatically computes intrinsic value, NPV, and essential metrics.
- User-Friendly: Step-by-step guidance ensures a smooth experience.
Who Should Use This Product?
- Institutional Investors: Develop comprehensive and trustworthy valuation models for portfolio management of FS KKR Capital Corp. (FSK).
- Corporate Finance Departments: Evaluate valuation scenarios to inform strategic decisions within their organizations.
- Financial Consultants and Advisors: Offer clients precise valuation insights for FS KKR Capital Corp. (FSK) stock.
- Students and Instructors: Utilize real market data to enhance learning and practice in financial modeling.
- Investment Enthusiasts: Gain insights into how companies like FS KKR Capital Corp. (FSK) are assessed in the financial markets.
What the Template Contains
- Pre-Filled DCF Model: FS KKR Capital Corp.'s (FSK) financial data preloaded for immediate use.
- WACC Calculator: Detailed calculations for Weighted Average Cost of Capital.
- Financial Ratios: Evaluate FS KKR Capital Corp.'s (FSK) profitability, leverage, and efficiency.
- Editable Inputs: Change assumptions such as growth, margins, and CAPEX to fit your scenarios.
- Financial Statements: Annual and quarterly reports to support detailed analysis.
- Interactive Dashboard: Easily visualize key valuation metrics and results.
Disclaimer
All information, articles, and product details provided on this website are for general informational and educational purposes only. We do not claim any ownership over, nor do we intend to infringe upon, any trademarks, copyrights, logos, brand names, or other intellectual property mentioned or depicted on this site. Such intellectual property remains the property of its respective owners, and any references here are made solely for identification or informational purposes, without implying any affiliation, endorsement, or partnership.
We make no representations or warranties, express or implied, regarding the accuracy, completeness, or suitability of any content or products presented. Nothing on this website should be construed as legal, tax, investment, financial, medical, or other professional advice. In addition, no part of this site—including articles or product references—constitutes a solicitation, recommendation, endorsement, advertisement, or offer to buy or sell any securities, franchises, or other financial instruments, particularly in jurisdictions where such activity would be unlawful.
All content is of a general nature and may not address the specific circumstances of any individual or entity. It is not a substitute for professional advice or services. Any actions you take based on the information provided here are strictly at your own risk. You accept full responsibility for any decisions or outcomes arising from your use of this website and agree to release us from any liability in connection with your use of, or reliance upon, the content or products found herein.