
|
Goldman Sachs BDC, Inc. (GSBD) DCF -Bewertung |
Fully Editable: Tailor To Your Needs In Excel Or Sheets
Professional Design: Trusted, Industry-Standard Templates
Investor-Approved Valuation Models
MAC/PC Compatible, Fully Unlocked
No Expertise Is Needed; Easy To Follow
Goldman Sachs BDC, Inc. (GSBD) Bundle
Unser (GSBD) DCF-Taschenrechner (GSBD) wurde für die Genauigkeit entwickelt und ermöglicht es Ihnen, die Bewertung von Goldman Sachs BDC, Inc. unter Verwendung realer Finanzdaten zu bewerten und gleichzeitig vollständige Flexibilität zu bieten, um alle wesentlichen Parameter für erweiterte Projektionen zu ändern.
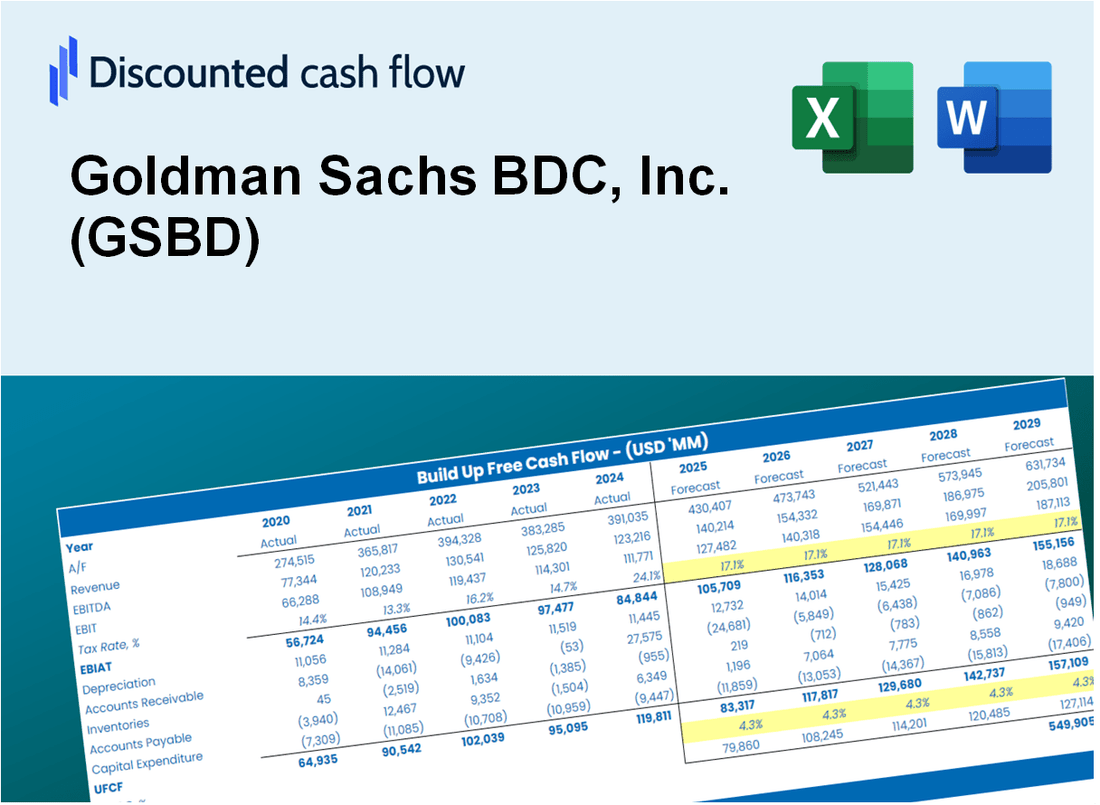
Discounted Cash Flow (DCF) - (USD MM)
| Year | AY1 2020 |
AY2 2021 |
AY3 2022 |
AY4 2023 |
AY5 2024 |
FY1 2025 |
FY2 2026 |
FY3 2027 |
FY4 2028 |
FY5 2029 |
|---|---|---|---|---|---|---|---|---|---|---|
| Revenue | 186.5 | 229.1 | 136.1 | 454.9 | 192.4 | 204.2 | 216.8 | 230.1 | 244.2 | 259.2 |
| Revenue Growth, % | 0 | 22.84 | -40.59 | 234.24 | -57.7 | 6.14 | 6.14 | 6.14 | 6.14 | 6.14 |
| EBITDA | 177.5 | 194.1 | 59.7 | .0 | 68.3 | 105.9 | 112.4 | 119.3 | 126.6 | 134.4 |
| EBITDA, % | 95.2 | 84.72 | 43.86 | 0 | 35.52 | 51.86 | 51.86 | 51.86 | 51.86 | 51.86 |
| Depreciation | .0 | .0 | .0 | -363.4 | .0 | -32.6 | -34.6 | -36.8 | -39.0 | -41.4 |
| Depreciation, % | 0 | 0 | 0 | -79.88 | 0 | -15.98 | -15.98 | -15.98 | -15.98 | -15.98 |
| EBIT | 177.5 | 194.1 | 59.7 | 363.4 | 68.3 | 138.5 | 147.1 | 156.1 | 165.7 | 175.8 |
| EBIT, % | 95.2 | 84.72 | 43.86 | 79.88 | 35.52 | 67.84 | 67.84 | 67.84 | 67.84 | 67.84 |
| Total Cash | 32.1 | 33.8 | 39.6 | 52.4 | 61.8 | 42.8 | 45.4 | 48.2 | 51.1 | 54.3 |
| Total Cash, percent | .0 | .0 | .0 | .0 | .0 | .0 | .0 | .0 | .0 | .0 |
| Account Receivables | 24.2 | 23.3 | 31.8 | 38.5 | 28.1 | 28.4 | 30.2 | 32.0 | 34.0 | 36.1 |
| Account Receivables, % | 12.97 | 10.16 | 23.35 | 8.47 | 14.6 | 13.91 | 13.91 | 13.91 | 13.91 | 13.91 |
| Inventories | .0 | .0 | .0 | .0 | .0 | .0 | .0 | .0 | .0 | .0 |
| Inventories, % | 0 | 0 | 0 | 0 | 0 | 0 | 0 | 0 | 0 | 0 |
| Accounts Payable | 55.9 | 60.8 | 59.6 | 62.7 | 74.1 | 62.3 | 66.1 | 70.2 | 74.5 | 79.1 |
| Accounts Payable, % | 29.95 | 26.52 | 43.78 | 13.78 | 38.49 | 30.51 | 30.51 | 30.51 | 30.51 | 30.51 |
| Capital Expenditure | .0 | .0 | .0 | .0 | .0 | .0 | .0 | .0 | .0 | .0 |
| Capital Expenditure, % | 0 | 0 | 0 | 0 | 0 | 0 | 0 | 0 | 0 | 0 |
| Tax Rate, % | 8.02 | 8.02 | 8.02 | 8.02 | 8.02 | 8.02 | 8.02 | 8.02 | 8.02 | 8.02 |
| EBITAT | 176.1 | 192.4 | 55.0 | 353.5 | 62.9 | 132.9 | 141.1 | 149.8 | 158.9 | 168.7 |
| Depreciation | ||||||||||
| Changes in Account Receivables | ||||||||||
| Changes in Inventories | ||||||||||
| Changes in Accounts Payable | ||||||||||
| Capital Expenditure | ||||||||||
| UFCF | 207.8 | 198.2 | 45.3 | -13.6 | 84.7 | 88.2 | 108.5 | 115.2 | 122.3 | 129.8 |
| WACC, % | 6.25 | 6.24 | 5.98 | 6.17 | 5.98 | 6.12 | 6.12 | 6.12 | 6.12 | 6.12 |
| PV UFCF | ||||||||||
| SUM PV UFCF | 468.7 | |||||||||
| Long Term Growth Rate, % | 2.00 | |||||||||
| Free cash flow (T + 1) | 132 | |||||||||
| Terminal Value | 3,209 | |||||||||
| Present Terminal Value | 2,384 | |||||||||
| Enterprise Value | 2,853 | |||||||||
| Net Debt | 1,868 | |||||||||
| Equity Value | 985 | |||||||||
| Diluted Shares Outstanding, MM | 115 | |||||||||
| Equity Value Per Share | 8.59 |
What You Will Get
- Real Goldman Sachs BDC Data: Preloaded financials – from revenue to EBIT – based on actual and projected figures.
- Full Customization: Adjust all critical parameters (yellow cells) like WACC, growth %, and tax rates.
- Instant Valuation Updates: Automatic recalculations to analyze the impact of changes on Goldman Sachs BDC’s fair value.
- Versatile Excel Template: Tailored for quick edits, scenario testing, and detailed projections.
- Time-Saving and Accurate: Skip building models from scratch while maintaining precision and flexibility.
Key Features
- Comprehensive Financial Data: Goldman Sachs BDC, Inc.'s historical financial statements and pre-filled projections.
- Customizable Parameters: Modify WACC, tax rates, revenue growth, and EBITDA margins to fit your analysis.
- Real-Time Valuation: Observe Goldman Sachs BDC, Inc.'s intrinsic value update instantly.
- Intuitive Visuals: Dashboard graphics present valuation outcomes and essential metrics clearly.
- Designed for Precision: A reliable tool tailored for analysts, investors, and finance professionals.
How It Works
- Step 1: Download the Excel file for Goldman Sachs BDC, Inc. (GSBD).
- Step 2: Review the pre-filled financial data and forecasts for Goldman Sachs BDC, Inc. (GSBD).
- Step 3: Adjust key inputs such as revenue growth, WACC, and tax rates (highlighted cells).
- Step 4: Observe the DCF model update in real-time as you modify your assumptions.
- Step 5: Evaluate the outputs and leverage the results for your investment strategies.
Why Choose This Calculator for Goldman Sachs BDC, Inc. (GSBD)?
- User-Friendly Interface: Tailored for both novice users and seasoned professionals.
- Customizable Inputs: Adjust assumptions effortlessly to suit your financial analysis.
- Real-Time Valuation: Observe immediate updates to Goldman Sachs BDC’s valuation with input changes.
- Preloaded Data: Comes with Goldman Sachs BDC’s actual financial metrics for swift evaluations.
- Preferred by Experts: A go-to tool for investors and analysts seeking reliable insights.
Who Should Use Goldman Sachs BDC, Inc. (GSBD)?
- Investors: Gain insights and make informed choices with a leading investment vehicle.
- Financial Analysts: Streamline your analysis with comprehensive data and reports tailored for GSBD.
- Consultants: Effortlessly modify resources for client engagements or investment strategies involving GSBD.
- Finance Enthusiasts: Enhance your knowledge of business development companies through GSBD's performance and strategies.
- Educators and Students: Utilize GSBD as a case study for practical applications in finance education.
What the Template Contains
- Operating and Balance Sheet Data: Pre-filled Goldman Sachs BDC, Inc. (GSBD) historical data and forecasts, including revenue, EBITDA, EBIT, and capital expenditures.
- WACC Calculation: A dedicated sheet for Weighted Average Cost of Capital (WACC), including parameters like Beta, risk-free rate, and share price.
- DCF Valuation (Unlevered and Levered): Editable Discounted Cash Flow models showing intrinsic value with detailed calculations.
- Financial Statements: Pre-loaded financial statements (annual and quarterly) to support analysis.
- Key Ratios: Includes profitability, leverage, and efficiency ratios for Goldman Sachs BDC, Inc. (GSBD).
- Dashboard and Charts: Visual summary of valuation outputs and assumptions to analyze results easily.
Disclaimer
All information, articles, and product details provided on this website are for general informational and educational purposes only. We do not claim any ownership over, nor do we intend to infringe upon, any trademarks, copyrights, logos, brand names, or other intellectual property mentioned or depicted on this site. Such intellectual property remains the property of its respective owners, and any references here are made solely for identification or informational purposes, without implying any affiliation, endorsement, or partnership.
We make no representations or warranties, express or implied, regarding the accuracy, completeness, or suitability of any content or products presented. Nothing on this website should be construed as legal, tax, investment, financial, medical, or other professional advice. In addition, no part of this site—including articles or product references—constitutes a solicitation, recommendation, endorsement, advertisement, or offer to buy or sell any securities, franchises, or other financial instruments, particularly in jurisdictions where such activity would be unlawful.
All content is of a general nature and may not address the specific circumstances of any individual or entity. It is not a substitute for professional advice or services. Any actions you take based on the information provided here are strictly at your own risk. You accept full responsibility for any decisions or outcomes arising from your use of this website and agree to release us from any liability in connection with your use of, or reliance upon, the content or products found herein.