
|
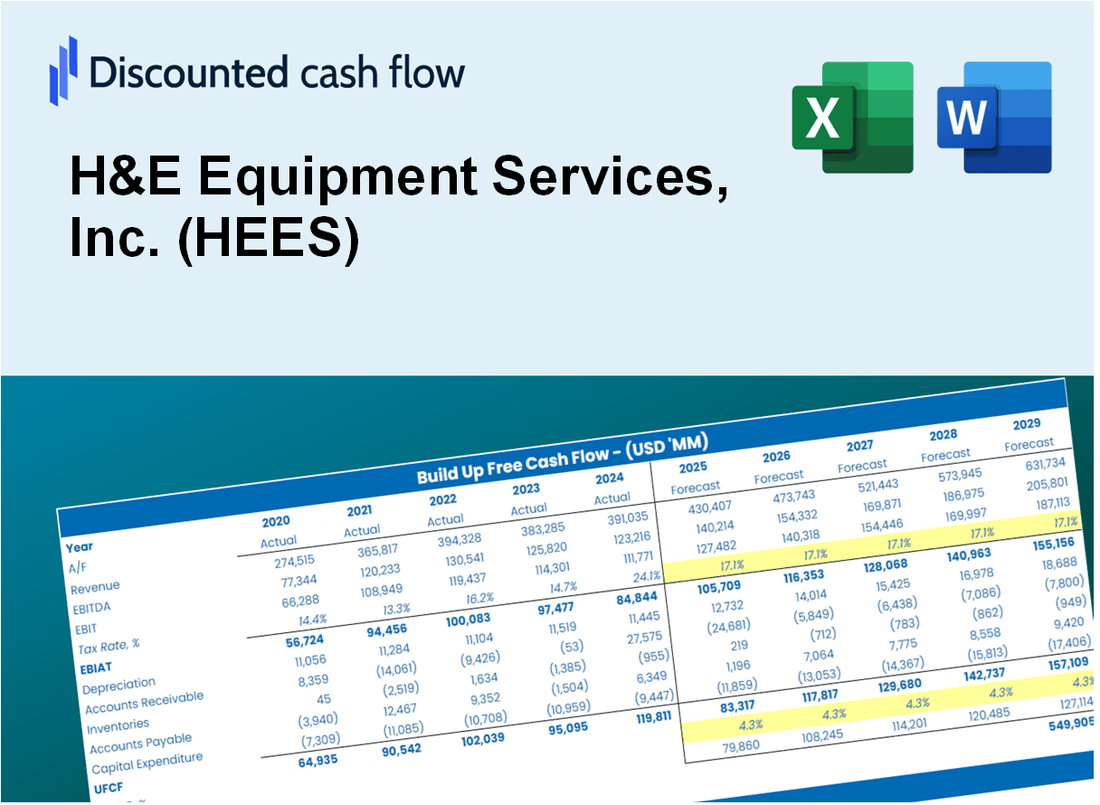
H & E Equipment Services, Inc. (HEES) DCF -Bewertung |
Fully Editable: Tailor To Your Needs In Excel Or Sheets
Professional Design: Trusted, Industry-Standard Templates
Investor-Approved Valuation Models
MAC/PC Compatible, Fully Unlocked
No Expertise Is Needed; Easy To Follow
H&E Equipment Services, Inc. (HEES) Bundle
Unser (HEES) DCF-Taschenrechner wurde für die Genauigkeit entwickelt und ermöglicht es Ihnen, die Bewertung von H & E Equipment Services, Inc. mithilfe realer Finanzdaten zu bewerten, und bietet vollständige Flexibilität, um alle wesentlichen Parameter für erweiterte Projektionen zu ändern.
What You Will Get
- Real H&E Equipment Data: Preloaded financials – from revenue to EBIT – based on actual and projected figures.
- Full Customization: Adjust all critical parameters (yellow cells) like WACC, growth %, and tax rates.
- Instant Valuation Updates: Automatic recalculations to analyze the impact of changes on H&E Equipment's fair value.
- Versatile Excel Template: Tailored for quick edits, scenario testing, and detailed projections.
- Time-Saving and Accurate: Skip building models from scratch while maintaining precision and flexibility.
Key Features
- 🔍 Real-Life HEES Financials: Pre-filled historical and projected data for H&E Equipment Services, Inc. (HEES).
- ✏️ Fully Customizable Inputs: Adjust all critical parameters (yellow cells) like WACC, growth %, and tax rates.
- 📊 Professional DCF Valuation: Built-in formulas calculate H&E Equipment's intrinsic value using the Discounted Cash Flow method.
- ⚡ Instant Results: Visualize H&E Equipment's valuation instantly after making changes.
- Scenario Analysis: Test and compare outcomes for various financial assumptions side-by-side.
How It Works
- Step 1: Download the Excel file for H&E Equipment Services, Inc. (HEES).
- Step 2: Review the pre-filled financial data and forecasts for H&E Equipment Services.
- Step 3: Adjust key inputs such as revenue growth, WACC, and tax rates (highlighted cells).
- Step 4: Observe the DCF model update in real-time as you modify your assumptions.
- Step 5: Analyze the results and leverage them for your investment strategies.
Why Choose This Calculator for H&E Equipment Services, Inc. (HEES)?
- Accurate Data: Utilize real financials from H&E Equipment Services for dependable valuation outcomes.
- Customizable: Tailor critical inputs such as growth rates, WACC, and tax rates to align with your forecasts.
- Time-Saving: Built-in calculations allow you to avoid starting from square one.
- Professional-Grade Tool: Crafted for investors, analysts, and consultants working with H&E Equipment Services.
- User-Friendly: An intuitive design and clear instructions make it accessible for all users.
Who Should Use This Product?
- Investors: Assess H&E Equipment Services, Inc.'s (HEES) valuation before making investment decisions.
- CFOs and Financial Analysts: Enhance valuation methodologies and evaluate financial forecasts.
- Startup Founders: Understand the valuation processes of established companies like H&E Equipment Services, Inc.
- Consultants: Create detailed valuation reports for clients in the equipment rental industry.
- Students and Educators: Utilize industry data to practice and teach valuation strategies.
What the Template Contains
- Comprehensive DCF Model: Editable template featuring detailed valuation calculations tailored for H&E Equipment Services, Inc. (HEES).
- Real-World Data: H&E Equipment Services, Inc.'s historical and projected financials preloaded for in-depth analysis.
- Customizable Parameters: Modify WACC, growth rates, and tax assumptions to explore various scenarios.
- Financial Statements: Complete annual and quarterly breakdowns for enhanced insights into financial performance.
- Key Ratios: Integrated analysis for profitability, efficiency, and leverage metrics specific to H&E Equipment Services, Inc. (HEES).
- Dashboard with Visual Outputs: Charts and tables designed to present clear, actionable results for informed decision-making.
Disclaimer
All information, articles, and product details provided on this website are for general informational and educational purposes only. We do not claim any ownership over, nor do we intend to infringe upon, any trademarks, copyrights, logos, brand names, or other intellectual property mentioned or depicted on this site. Such intellectual property remains the property of its respective owners, and any references here are made solely for identification or informational purposes, without implying any affiliation, endorsement, or partnership.
We make no representations or warranties, express or implied, regarding the accuracy, completeness, or suitability of any content or products presented. Nothing on this website should be construed as legal, tax, investment, financial, medical, or other professional advice. In addition, no part of this site—including articles or product references—constitutes a solicitation, recommendation, endorsement, advertisement, or offer to buy or sell any securities, franchises, or other financial instruments, particularly in jurisdictions where such activity would be unlawful.
All content is of a general nature and may not address the specific circumstances of any individual or entity. It is not a substitute for professional advice or services. Any actions you take based on the information provided here are strictly at your own risk. You accept full responsibility for any decisions or outcomes arising from your use of this website and agree to release us from any liability in connection with your use of, or reliance upon, the content or products found herein.