
|
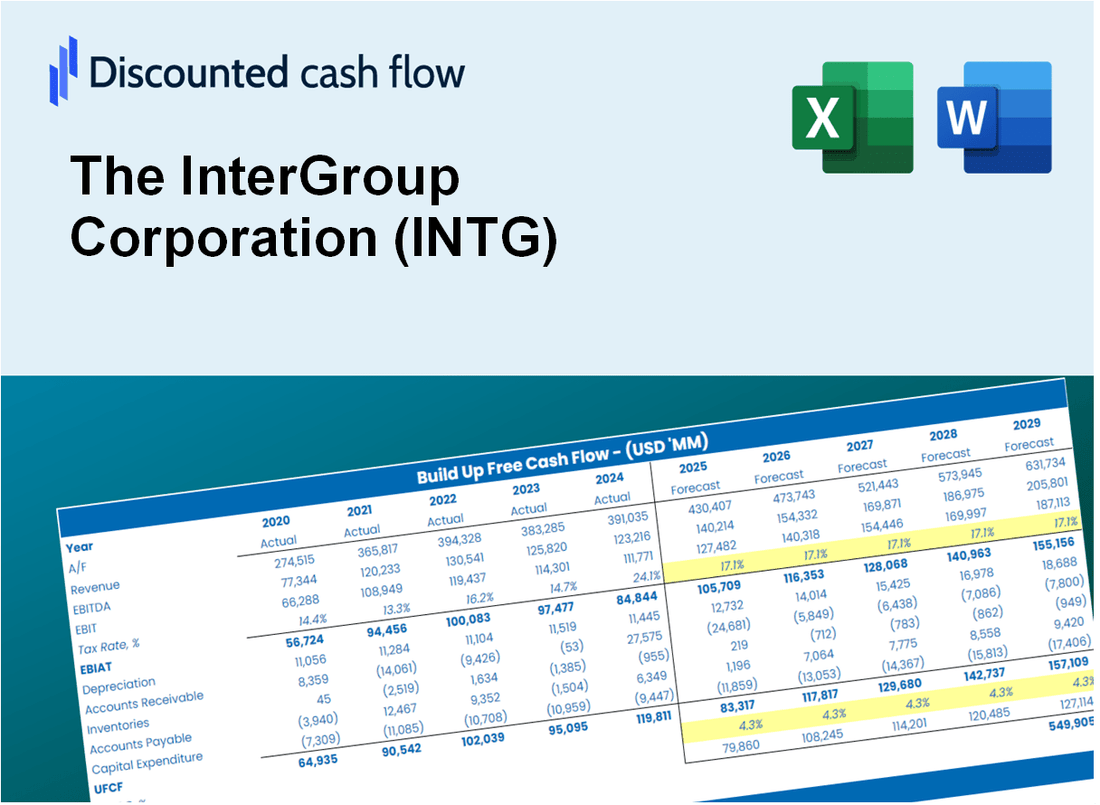
Die DCF -Bewertung der Intergroup Corporation (INTG) |
Fully Editable: Tailor To Your Needs In Excel Or Sheets
Professional Design: Trusted, Industry-Standard Templates
Investor-Approved Valuation Models
MAC/PC Compatible, Fully Unlocked
No Expertise Is Needed; Easy To Follow
The InterGroup Corporation (INTG) Bundle
Unser (INTG) DCF -Taschenrechner (INTG) ermöglicht es Ihnen, die Bewertung der Intergroup Corporation anhand der relevanten Finanzdaten zu bewerten und vollständige Flexibilität zu bieten, um alle wesentlichen Parameter für verbesserte Prognosen zu ändern.
What You Will Get
- Real INTG Financial Data: Pre-filled with The InterGroup Corporation’s historical and projected data for precise analysis.
- Fully Editable Template: Modify key inputs like revenue growth, WACC, and EBITDA % with ease.
- Automatic Calculations: See The InterGroup Corporation’s intrinsic value update instantly based on your changes.
- Professional Valuation Tool: Designed for investors, analysts, and consultants seeking accurate DCF results.
- User-Friendly Design: Simple structure and clear instructions for all experience levels.
Key Features
- Comprehensive INTG Data: Pre-loaded with The InterGroup Corporation's historical performance metrics and future projections.
- Customizable Parameters: Tailor inputs such as revenue growth, profit margins, discount rates, tax implications, and capital expenditures.
- Interactive Valuation Framework: Real-time updates to Net Present Value (NPV) and intrinsic value based on user-defined inputs.
- Scenario Analysis: Develop various forecasting scenarios to explore different valuation possibilities.
- Intuitive Interface: Designed for ease of use, accessible for both industry experts and newcomers.
How It Works
- Step 1: Download the Excel file for The InterGroup Corporation (INTG).
- Step 2: Review the pre-filled financial data and forecasts for The InterGroup Corporation (INTG).
- Step 3: Adjust key inputs such as revenue growth, WACC, and tax rates (highlighted cells) for The InterGroup Corporation (INTG).
- Step 4: Observe the DCF model update in real-time as you modify your assumptions for The InterGroup Corporation (INTG).
- Step 5: Evaluate the outputs and leverage the results for your investment decisions regarding The InterGroup Corporation (INTG).
Why Choose The InterGroup Corporation (INTG)?
- Proven Track Record: Established history of delivering exceptional financial performance.
- Expert Management: Led by a team of seasoned professionals with extensive industry experience.
- Innovative Solutions: Committed to providing cutting-edge services that meet evolving market needs.
- Strong Investor Relations: Transparent communication and regular updates to keep stakeholders informed.
- Commitment to Sustainability: Focused on responsible practices that benefit both the community and the environment.
Who Should Utilize The InterGroup Corporation (INTG)?
- Investors: Make informed decisions with a reliable investment platform tailored for your needs.
- Financial Analysts: Enhance your efficiency with comprehensive reports and analysis tools at your fingertips.
- Consultants: Easily customize resources for client engagements and strategic presentations.
- Finance Enthusiasts: Expand your knowledge of investment strategies through practical insights and case studies.
- Educators and Students: Leverage real-world scenarios for a deeper understanding of corporate finance principles.
What the Template Contains
- Historical Data: Includes The InterGroup Corporation's (INTG) past financials and baseline forecasts.
- DCF and Levered DCF Models: Detailed templates to calculate The InterGroup Corporation's (INTG) intrinsic value.
- WACC Sheet: Pre-built calculations for Weighted Average Cost of Capital.
- Editable Inputs: Modify key drivers like growth rates, EBITDA %, and CAPEX assumptions.
- Quarterly and Annual Statements: A complete breakdown of The InterGroup Corporation's (INTG) financials.
- Interactive Dashboard: Visualize valuation results and projections dynamically.
Disclaimer
All information, articles, and product details provided on this website are for general informational and educational purposes only. We do not claim any ownership over, nor do we intend to infringe upon, any trademarks, copyrights, logos, brand names, or other intellectual property mentioned or depicted on this site. Such intellectual property remains the property of its respective owners, and any references here are made solely for identification or informational purposes, without implying any affiliation, endorsement, or partnership.
We make no representations or warranties, express or implied, regarding the accuracy, completeness, or suitability of any content or products presented. Nothing on this website should be construed as legal, tax, investment, financial, medical, or other professional advice. In addition, no part of this site—including articles or product references—constitutes a solicitation, recommendation, endorsement, advertisement, or offer to buy or sell any securities, franchises, or other financial instruments, particularly in jurisdictions where such activity would be unlawful.
All content is of a general nature and may not address the specific circumstances of any individual or entity. It is not a substitute for professional advice or services. Any actions you take based on the information provided here are strictly at your own risk. You accept full responsibility for any decisions or outcomes arising from your use of this website and agree to release us from any liability in connection with your use of, or reliance upon, the content or products found herein.