
|
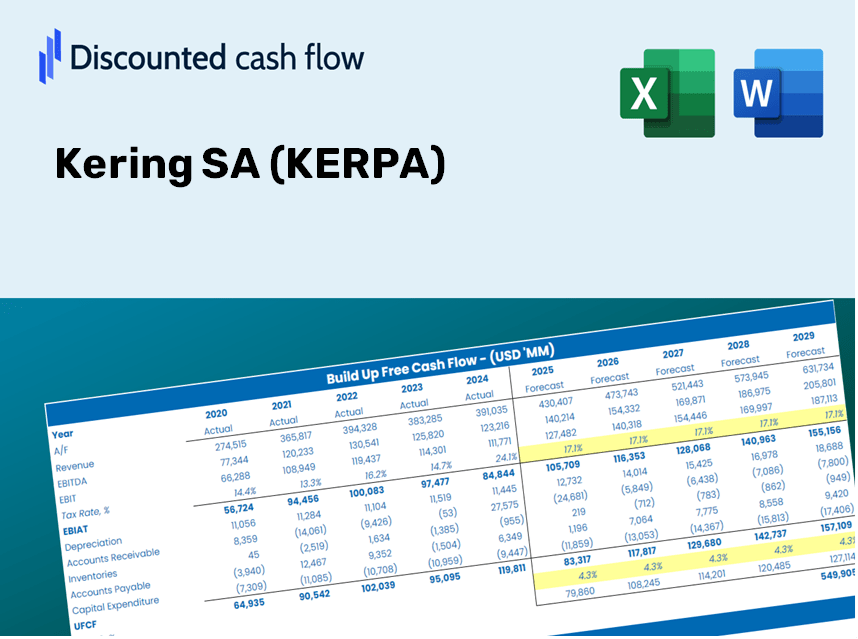
Kering SA (Ker.Pa) DCF -Bewertung |
Fully Editable: Tailor To Your Needs In Excel Or Sheets
Professional Design: Trusted, Industry-Standard Templates
Investor-Approved Valuation Models
MAC/PC Compatible, Fully Unlocked
No Expertise Is Needed; Easy To Follow
Kering SA (KER.PA) Bundle
Entdecken Sie den finanziellen Ausblick von Kering SA (KERPA) mit unserem benutzerfreundlichen DCF-Taschenrechner! Geben Sie Ihre Prognosen für Wachstum, Margen und Ausgaben ein, um den inneren Wert von Kering SA zu berechnen und Ihre Anlagestrategie zu informieren.
What You'll Receive
- Comprehensive Financial Model: Utilize Kering SA’s actual data for an accurate DCF valuation.
- Complete Forecast Flexibility: Modify revenue growth, profit margins, WACC, and other essential metrics.
- Real-Time Calculations: Instant updates enable you to view results as adjustments are made.
- Professional-Grade Template: A polished Excel file crafted for high-quality valuations.
- Adaptable and Reusable: Designed for versatility, facilitating repeated detailed forecasts.
Key Features
- Pre-Loaded Data: Kering SA’s historical financial statements and pre-filled forecasts.
- Fully Adjustable Inputs: Modify WACC, tax rates, revenue growth, and EBITDA margins as needed.
- Instant Results: Observe Kering SA's intrinsic value recalculating in real-time.
- Clear Visual Outputs: Dashboard charts illustrate valuation outcomes and key metrics.
- Built for Accuracy: A professional-grade tool designed for analysts, investors, and finance professionals.
How It Operates
- Download: Get the pre-built Excel file containing Kering SA’s financial data.
- Customize: Modify forecasts, such as revenue growth, EBITDA%, and WACC.
- Update Automatically: Intrinsic value and NPV calculations refresh in real-time.
- Test Scenarios: Develop various projections and immediately assess results.
- Make Decisions: Utilize the valuation findings to inform your investment approach.
Why Opt for This Calculator?
- All-in-One Solution: Features DCF, WACC, and financial ratio analyses all integrated in one tool.
- Flexible Variables: Modify the yellow-highlighted cells to explore different scenarios.
- In-Depth Analysis: Automatically determines Kering SA's intrinsic value and Net Present Value.
- Built-In Data: Historical and projected data provide reliable starting points for your calculations.
- High-Quality Standards: Perfect for financial analysts, investors, and business consultants.
Who Should Utilize This Product?
- Finance Students: Master valuation methodologies and apply them to real-world data.
- Academics: Integrate industry-standard models into your teaching or research projects.
- Investors: Challenge your assumptions and evaluate valuation analyses for Kering SA (KERPA) stock.
- Analysts: Enhance your efficiency with a ready-to-use, customizable DCF model.
- Small Business Owners: Understand how major public companies like Kering SA (KERPA) are evaluated.
Contents of the Template
- Pre-Filled Data: Contains Kering SA's historical financials and projections.
- Discounted Cash Flow Model: An editable DCF valuation model with automatic calculations.
- Weighted Average Cost of Capital (WACC): A specific sheet for WACC calculations using custom inputs.
- Key Financial Ratios: Evaluate Kering SA's profitability, efficiency, and leverage metrics.
- Customizable Inputs: Easily adjust revenue growth, margins, and tax rates.
- Clear Dashboard: Visual charts and tables summarizing essential valuation outcomes.
Disclaimer
All information, articles, and product details provided on this website are for general informational and educational purposes only. We do not claim any ownership over, nor do we intend to infringe upon, any trademarks, copyrights, logos, brand names, or other intellectual property mentioned or depicted on this site. Such intellectual property remains the property of its respective owners, and any references here are made solely for identification or informational purposes, without implying any affiliation, endorsement, or partnership.
We make no representations or warranties, express or implied, regarding the accuracy, completeness, or suitability of any content or products presented. Nothing on this website should be construed as legal, tax, investment, financial, medical, or other professional advice. In addition, no part of this site—including articles or product references—constitutes a solicitation, recommendation, endorsement, advertisement, or offer to buy or sell any securities, franchises, or other financial instruments, particularly in jurisdictions where such activity would be unlawful.
All content is of a general nature and may not address the specific circumstances of any individual or entity. It is not a substitute for professional advice or services. Any actions you take based on the information provided here are strictly at your own risk. You accept full responsibility for any decisions or outcomes arising from your use of this website and agree to release us from any liability in connection with your use of, or reliance upon, the content or products found herein.