
|
Lamar Advertising Company (LAMR) DCF -Bewertung |
Fully Editable: Tailor To Your Needs In Excel Or Sheets
Professional Design: Trusted, Industry-Standard Templates
Investor-Approved Valuation Models
MAC/PC Compatible, Fully Unlocked
No Expertise Is Needed; Easy To Follow
Lamar Advertising Company (LAMR) Bundle
Möchten Sie den inneren Wert von Lamar Advertising Company bestimmen? Unser (LAMR) DCF-Taschenrechner integriert reale Daten mit umfangreichen Anpassungsfunktionen, sodass Sie Prognosen anpassen und Ihre Anlagestrategien verbessern können.
What You Will Get
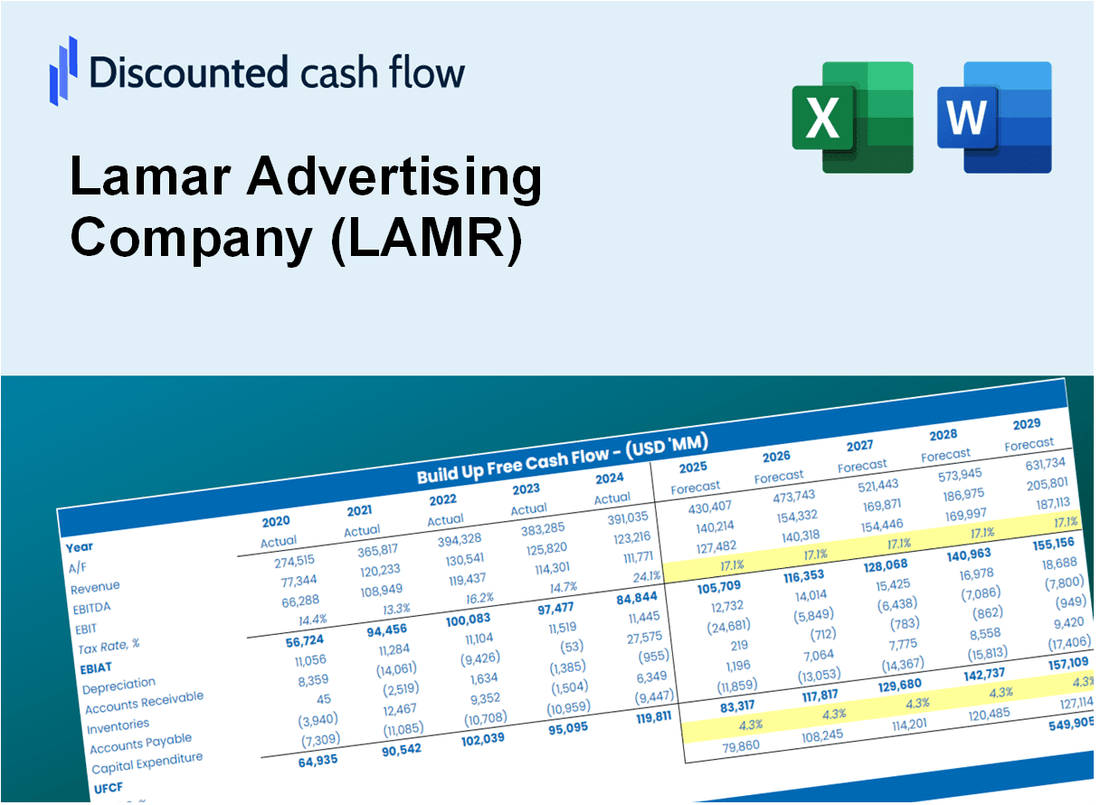
- Real Lamar Data: Preloaded financials – covering metrics from revenue to EBIT – based on actual and projected figures.
- Full Customization: Modify all essential parameters (yellow cells) such as WACC, growth %, and tax rates.
- Instant Valuation Updates: Automatic recalculations to evaluate the effects of changes on Lamar’s fair value.
- Versatile Excel Template: Designed for quick edits, scenario testing, and comprehensive projections.
- Time-Saving and Accurate: Avoid building models from the ground up while ensuring precision and adaptability.
Key Features
- Customizable Revenue Inputs: Adjust key metrics such as advertising revenue growth, operating margins, and capital investments.
- Instant DCF Valuation: Quickly computes intrinsic value, NPV, and various financial outputs.
- High-Precision Accuracy: Leverages Lamar Advertising's actual financial data for credible valuation results.
- Effortless Scenario Analysis: Evaluate different scenarios and easily compare the results.
- Efficiency Booster: Remove the hassle of creating intricate valuation models from the ground up.
How It Works
- Step 1: Download the Excel file.
- Step 2: Review pre-entered Lamar Advertising Company (LAMR) data (historical and projected).
- Step 3: Adjust key assumptions (yellow cells) based on your analysis.
- Step 4: View automatic recalculations for Lamar Advertising Company’s intrinsic value.
- Step 5: Use the outputs for investment decisions or reporting.
Why Choose Lamar Advertising Company (LAMR)?
- Industry Leader: Benefit from a company with extensive experience in outdoor advertising.
- Wide Reach: Access to a vast network of billboard locations across the country.
- Innovative Solutions: Utilize cutting-edge technology to enhance your advertising campaigns.
- Data-Driven Insights: Leverage analytics to optimize your advertising strategy and maximize impact.
- Client-Centric Approach: Enjoy personalized service and support tailored to your business needs.
Who Should Use This Product?
- Individual Investors: Gain insights to make informed decisions about buying or selling Lamar Advertising Company (LAMR) stock.
- Financial Analysts: Enhance valuation processes with comprehensive financial models tailored for Lamar Advertising Company (LAMR).
- Consultants: Provide clients with accurate and timely valuation insights related to Lamar Advertising Company (LAMR).
- Business Owners: Learn how advertising companies like Lamar Advertising Company (LAMR) are valued to inform your own business strategies.
- Finance Students: Explore valuation techniques using real-world data and case studies from Lamar Advertising Company (LAMR).
What the Template Contains
- Preloaded LAMR Data: Historical and projected financial data, including revenue, EBIT, and capital expenditures.
- DCF and WACC Models: Professional-grade sheets for calculating intrinsic value and Weighted Average Cost of Capital.
- Editable Inputs: Yellow-highlighted cells for adjusting revenue growth, tax rates, and discount rates.
- Financial Statements: Comprehensive annual and quarterly financials for deeper analysis.
- Key Ratios: Profitability, leverage, and efficiency ratios to evaluate performance.
- Dashboard and Charts: Visual summaries of valuation outcomes and assumptions.
Disclaimer
All information, articles, and product details provided on this website are for general informational and educational purposes only. We do not claim any ownership over, nor do we intend to infringe upon, any trademarks, copyrights, logos, brand names, or other intellectual property mentioned or depicted on this site. Such intellectual property remains the property of its respective owners, and any references here are made solely for identification or informational purposes, without implying any affiliation, endorsement, or partnership.
We make no representations or warranties, express or implied, regarding the accuracy, completeness, or suitability of any content or products presented. Nothing on this website should be construed as legal, tax, investment, financial, medical, or other professional advice. In addition, no part of this site—including articles or product references—constitutes a solicitation, recommendation, endorsement, advertisement, or offer to buy or sell any securities, franchises, or other financial instruments, particularly in jurisdictions where such activity would be unlawful.
All content is of a general nature and may not address the specific circumstances of any individual or entity. It is not a substitute for professional advice or services. Any actions you take based on the information provided here are strictly at your own risk. You accept full responsibility for any decisions or outcomes arising from your use of this website and agree to release us from any liability in connection with your use of, or reliance upon, the content or products found herein.