
|
Brasilagro - Companhia Brasileira de Proveriedades Agrícolas (LND) DCF -Bewertung |
Fully Editable: Tailor To Your Needs In Excel Or Sheets
Professional Design: Trusted, Industry-Standard Templates
Investor-Approved Valuation Models
MAC/PC Compatible, Fully Unlocked
No Expertise Is Needed; Easy To Follow
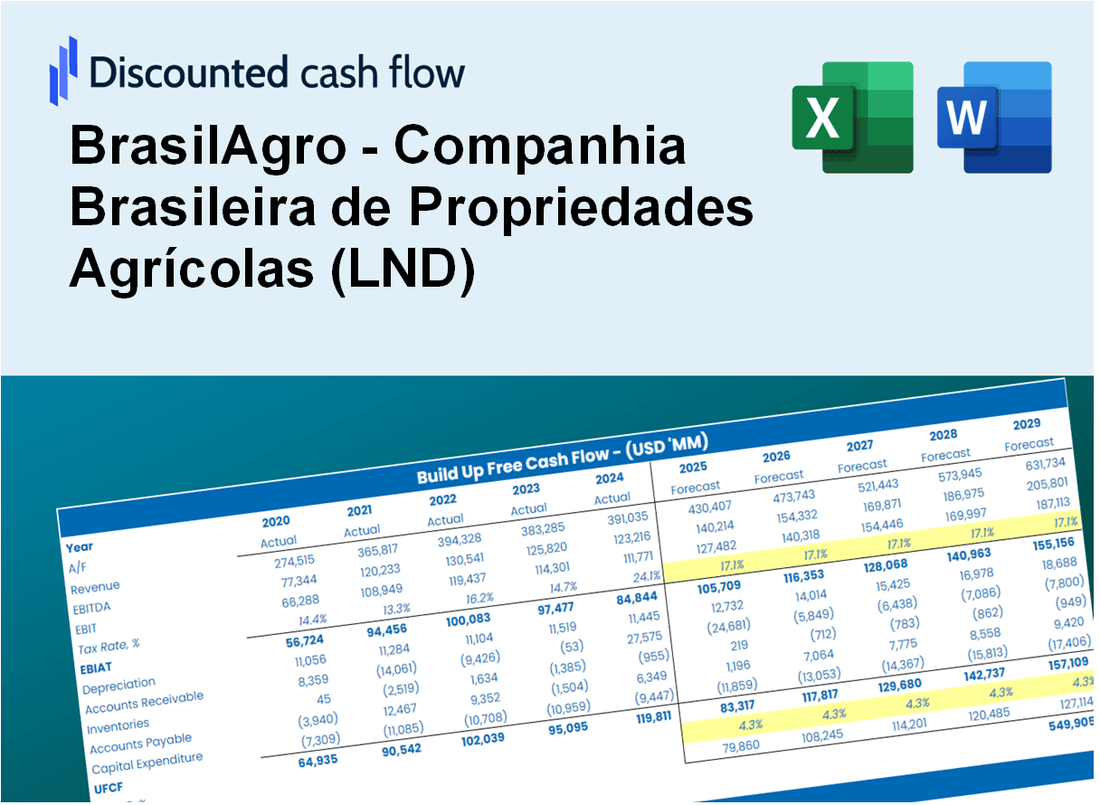
BrasilAgro - Companhia Brasileira de Propriedades Agrícolas (LND) Bundle
Unser (LND) DCF -Taschenrechner entwickelt zur Genauigkeit und ermöglicht es Ihnen, Brasilagro zu bewerten.
What You Will Receive
- Flexible Forecast Inputs: Effortlessly adjust key parameters (growth %, margins, WACC) to explore various scenarios.
- Current Market Data: BrasilAgro’s financial information pre-loaded to enhance your analysis.
- Instant DCF Calculations: The template automatically computes Net Present Value (NPV) and intrinsic value for you.
- Tailored and Professional: A refined Excel model designed to meet your valuation requirements.
- Designed for Analysts and Investors: Perfect for evaluating projections, confirming strategies, and optimizing efficiency.
Key Features
- Comprehensive Historical Data: BrasilAgro's past financial statements and detailed forecasts.
- Customizable Parameters: Adjust WACC, tax rates, revenue growth, and EBITDA margins as needed.
- Real-Time Valuation: Monitor BrasilAgro's intrinsic value recalculating live.
- Intuitive Visualizations: Dashboard graphs showcase valuation outcomes and essential metrics.
- Designed for Precision: A robust tool tailored for analysts, investors, and financial professionals.
How It Works
- Step 1: Download the Excel file.
- Step 2: Review pre-entered BrasilAgro (LND) data (historical and projected).
- Step 3: Adjust key assumptions (yellow cells) based on your analysis.
- Step 4: View automatic recalculations for BrasilAgro’s intrinsic value.
- Step 5: Use the outputs for investment decisions or reporting.
Why Choose This Calculator for BrasilAgro (LND)?
- Accurate Data: Utilize real BrasilAgro financials for dependable valuation outcomes.
- Customizable: Tailor essential metrics such as growth rates, WACC, and tax rates to fit your forecasts.
- Time-Saving: Built-in calculations streamline the process, so you don’t have to start from scratch.
- Professional-Grade Tool: Crafted for investors, analysts, and agricultural consultants.
- User-Friendly: An intuitive design and clear instructions ensure accessibility for all users.
Who Should Use This Product?
- Agricultural Investors: Develop comprehensive and accurate valuation models for portfolio assessments related to BrasilAgro (LND).
- Corporate Finance Teams: Evaluate valuation scenarios to inform strategic decisions within agricultural sectors.
- Consultants and Advisors: Deliver precise valuation insights for clients interested in BrasilAgro (LND).
- Students and Educators: Utilize real-world agricultural data to enhance financial modeling skills and education.
- Agribusiness Enthusiasts: Gain insights into how agricultural companies like BrasilAgro (LND) are valued in the market.
What the Template Contains
- Pre-Filled Data: Includes BrasilAgro’s historical financials and forecasts.
- Discounted Cash Flow Model: Editable DCF valuation model with automatic calculations.
- Weighted Average Cost of Capital (WACC): A dedicated sheet for calculating WACC based on custom inputs.
- Key Financial Ratios: Analyze BrasilAgro’s profitability, efficiency, and leverage.
- Customizable Inputs: Edit revenue growth, margins, and tax rates with ease.
- Clear Dashboard: Charts and tables summarizing key valuation results.
Disclaimer
All information, articles, and product details provided on this website are for general informational and educational purposes only. We do not claim any ownership over, nor do we intend to infringe upon, any trademarks, copyrights, logos, brand names, or other intellectual property mentioned or depicted on this site. Such intellectual property remains the property of its respective owners, and any references here are made solely for identification or informational purposes, without implying any affiliation, endorsement, or partnership.
We make no representations or warranties, express or implied, regarding the accuracy, completeness, or suitability of any content or products presented. Nothing on this website should be construed as legal, tax, investment, financial, medical, or other professional advice. In addition, no part of this site—including articles or product references—constitutes a solicitation, recommendation, endorsement, advertisement, or offer to buy or sell any securities, franchises, or other financial instruments, particularly in jurisdictions where such activity would be unlawful.
All content is of a general nature and may not address the specific circumstances of any individual or entity. It is not a substitute for professional advice or services. Any actions you take based on the information provided here are strictly at your own risk. You accept full responsibility for any decisions or outcomes arising from your use of this website and agree to release us from any liability in connection with your use of, or reliance upon, the content or products found herein.