
|
Marcus & Millichap, Inc. (MMI) DCF -Bewertung |
Fully Editable: Tailor To Your Needs In Excel Or Sheets
Professional Design: Trusted, Industry-Standard Templates
Investor-Approved Valuation Models
MAC/PC Compatible, Fully Unlocked
No Expertise Is Needed; Easy To Follow
Marcus & Millichap, Inc. (MMI) Bundle
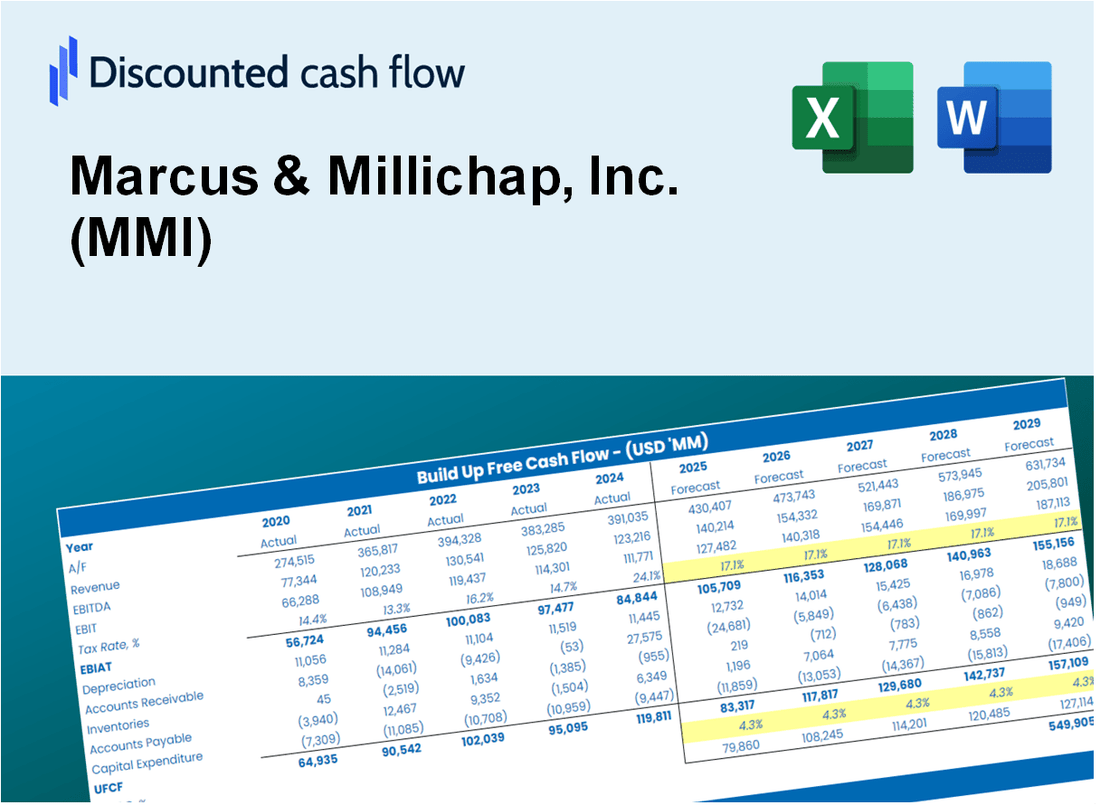
Egal, ob Sie ein Investor oder Analyst sind, dieser Marcus & Der DCF-Taschenrechner von Millichap, Inc. (MMI) ist Ihre Anlaufstelle für eine genaue Bewertung. Ausgestattet mit echten Daten von Marcus & In Millichap, Inc. können Sie Prognosen anpassen und die Auswirkungen in Echtzeit beobachten.
What You Will Receive
- Customizable Excel Template: A fully editable Excel-based DCF Calculator featuring pre-loaded financial data for Marcus & Millichap, Inc. (MMI).
- Real-Time Data: Access to historical performance metrics and forward-looking projections (highlighted in the yellow cells).
- Flexible Forecasting: Adjust key assumptions such as revenue growth, EBITDA %, and WACC as needed.
- Instant Calculations: Quickly observe how your inputs affect the valuation of Marcus & Millichap, Inc. (MMI).
- Professional Resource: Designed for investors, CFOs, consultants, and financial analysts.
- User-Centric Layout: Organized for straightforward navigation and usability, complete with detailed instructions.
Key Features
- Customizable Investment Metrics: Adjust essential parameters such as rental income growth, cap rate, and operating expenses.
- Instant Property Valuation: Generates market value, cash flow projections, and other key metrics in real-time.
- Industry-Leading Precision: Leverages Marcus & Millichap's extensive market data for accurate valuation results.
- Effortless Market Analysis: Evaluate various market conditions and analyze different investment scenarios with ease.
- Efficiency Booster: Streamline the valuation process without the need for intricate financial models.
How It Works
- Step 1: Download the Excel file for Marcus & Millichap, Inc. (MMI).
- Step 2: Review the pre-filled financial data and forecasts specific to Marcus & Millichap, Inc. (MMI).
- Step 3: Adjust key inputs such as revenue growth, WACC, and tax rates (highlighted cells).
- Step 4: Observe the DCF model update in real-time as you modify your assumptions.
- Step 5: Evaluate the outputs and leverage the findings for your investment strategies.
Why Choose Marcus & Millichap, Inc. (MMI)?
- Save Time: Utilize our expert insights without the hassle of extensive research – it’s all at your fingertips.
- Enhance Accuracy: Our industry-leading data and methodologies minimize the risk of errors in your investment decisions.
- Fully Customizable: Adapt our tools to align with your unique market strategies and forecasts.
- Easy to Understand: Intuitive visuals and straightforward outputs facilitate quick comprehension of complex data.
- Preferred by Professionals: Trusted by industry leaders who prioritize reliability and effectiveness in their analyses.
Who Should Use This Product?
- Real Estate Investors: Develop comprehensive and accurate investment models for property analysis.
- Commercial Real Estate Teams: Evaluate market trends to inform strategic decisions.
- Consultants and Advisors: Deliver precise valuation assessments for Marcus & Millichap, Inc. (MMI) clients.
- Students and Educators: Utilize real-time data to enhance learning in real estate finance.
- Market Analysts: Gain insights into how commercial real estate firms like Marcus & Millichap, Inc. (MMI) are positioned in the market.
What the Template Contains
- Pre-Filled DCF Model: Marcus & Millichap, Inc. (MMI)’s financial data preloaded for immediate use.
- WACC Calculator: Detailed calculations for Weighted Average Cost of Capital.
- Financial Ratios: Evaluate Marcus & Millichap, Inc. (MMI)’s profitability, leverage, and efficiency.
- Editable Inputs: Change assumptions such as growth, margins, and CAPEX to fit your scenarios.
- Financial Statements: Annual and quarterly reports to support detailed analysis.
- Interactive Dashboard: Easily visualize key valuation metrics and results.
Disclaimer
All information, articles, and product details provided on this website are for general informational and educational purposes only. We do not claim any ownership over, nor do we intend to infringe upon, any trademarks, copyrights, logos, brand names, or other intellectual property mentioned or depicted on this site. Such intellectual property remains the property of its respective owners, and any references here are made solely for identification or informational purposes, without implying any affiliation, endorsement, or partnership.
We make no representations or warranties, express or implied, regarding the accuracy, completeness, or suitability of any content or products presented. Nothing on this website should be construed as legal, tax, investment, financial, medical, or other professional advice. In addition, no part of this site—including articles or product references—constitutes a solicitation, recommendation, endorsement, advertisement, or offer to buy or sell any securities, franchises, or other financial instruments, particularly in jurisdictions where such activity would be unlawful.
All content is of a general nature and may not address the specific circumstances of any individual or entity. It is not a substitute for professional advice or services. Any actions you take based on the information provided here are strictly at your own risk. You accept full responsibility for any decisions or outcomes arising from your use of this website and agree to release us from any liability in connection with your use of, or reliance upon, the content or products found herein.