
|
Nexstar Media Group, Inc. (NXST) DCF -Bewertung |
Fully Editable: Tailor To Your Needs In Excel Or Sheets
Professional Design: Trusted, Industry-Standard Templates
Investor-Approved Valuation Models
MAC/PC Compatible, Fully Unlocked
No Expertise Is Needed; Easy To Follow
Nexstar Media Group, Inc. (NXST) Bundle
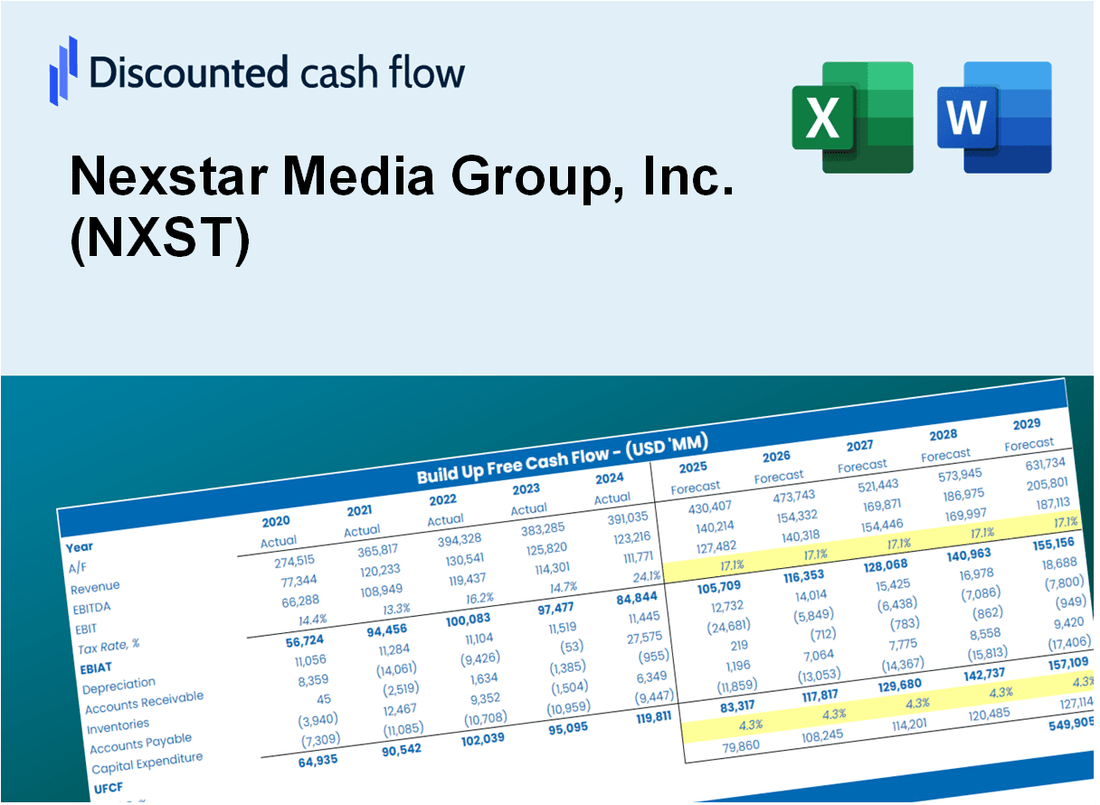
Unabhängig davon, ob Sie Investor oder Analyst sind, ist dieser (NXST) DCF-Taschenrechner Ihre Anlaufstelle für eine genaue Bewertung. Mit realen Daten von Nexstar Media Group, Inc. geladen, können Sie Prognosen anpassen und die Auswirkungen sofort beobachten.
Discounted Cash Flow (DCF) - (USD MM)
| Year | AY1 2020 |
AY2 2021 |
AY3 2022 |
AY4 2023 |
AY5 2024 |
FY1 2025 |
FY2 2026 |
FY3 2027 |
FY4 2028 |
FY5 2029 |
|---|---|---|---|---|---|---|---|---|---|---|
| Revenue | 4,501.3 | 4,648.0 | 5,211.0 | 4,933.0 | 5,407.0 | 5,672.6 | 5,951.2 | 6,243.5 | 6,550.1 | 6,871.8 |
| Revenue Growth, % | 0 | 3.26 | 12.11 | -5.33 | 9.61 | 4.91 | 4.91 | 4.91 | 4.91 | 4.91 |
| EBITDA | 2,004.8 | 1,965.0 | 2,216.0 | 1,789.0 | 2,211.0 | 2,342.7 | 2,457.8 | 2,578.5 | 2,705.2 | 2,838.0 |
| EBITDA, % | 44.54 | 42.28 | 42.53 | 36.27 | 40.89 | 41.3 | 41.3 | 41.3 | 41.3 | 41.3 |
| Depreciation | 564.9 | 589.0 | 662.0 | 941.0 | 808.0 | 816.2 | 856.3 | 898.4 | 942.5 | 988.8 |
| Depreciation, % | 12.55 | 12.67 | 12.7 | 19.08 | 14.94 | 14.39 | 14.39 | 14.39 | 14.39 | 14.39 |
| EBIT | 1,439.9 | 1,376.0 | 1,554.0 | 848.0 | 1,403.0 | 1,526.5 | 1,601.5 | 1,680.1 | 1,762.7 | 1,849.2 |
| EBIT, % | 31.99 | 29.6 | 29.82 | 17.19 | 25.95 | 26.91 | 26.91 | 26.91 | 26.91 | 26.91 |
| Total Cash | 152.7 | 190.9 | 204.0 | 147.0 | 144.0 | 193.5 | 203.0 | 213.0 | 223.5 | 234.4 |
| Total Cash, percent | .0 | .0 | .0 | .0 | .0 | .0 | .0 | .0 | .0 | .0 |
| Account Receivables | 904.8 | 1,021.0 | 1,080.0 | 1,095.0 | 1,028.0 | 1,179.9 | 1,237.9 | 1,298.7 | 1,362.5 | 1,429.4 |
| Account Receivables, % | 20.1 | 21.97 | 20.73 | 22.2 | 19.01 | 20.8 | 20.8 | 20.8 | 20.8 | 20.8 |
| Inventories | .0 | .0 | .0 | .0 | .0 | .0 | .0 | .0 | .0 | .0 |
| Inventories, % | 0 | 0 | 0 | 0 | 0 | 0 | 0 | 0 | 0 | 0 |
| Accounts Payable | 218.4 | 248.2 | 198.0 | 235.0 | 133.0 | 240.7 | 252.5 | 264.9 | 277.9 | 291.6 |
| Accounts Payable, % | 4.85 | 5.34 | 3.8 | 4.76 | 2.46 | 4.24 | 4.24 | 4.24 | 4.24 | 4.24 |
| Capital Expenditure | -217.0 | -151.0 | -157.0 | -149.0 | -145.0 | -190.4 | -199.8 | -209.6 | -219.9 | -230.7 |
| Capital Expenditure, % | -4.82 | -3.25 | -3.01 | -3.02 | -2.68 | -3.36 | -3.36 | -3.36 | -3.36 | -3.36 |
| Tax Rate, % | 24.71 | 24.71 | 24.71 | 24.71 | 24.71 | 24.71 | 24.71 | 24.71 | 24.71 | 24.71 |
| EBITAT | 1,057.8 | 1,049.9 | 1,239.9 | 731.7 | 1,056.3 | 1,194.1 | 1,252.8 | 1,314.3 | 1,378.8 | 1,446.6 |
| Depreciation | ||||||||||
| Changes in Account Receivables | ||||||||||
| Changes in Inventories | ||||||||||
| Changes in Accounts Payable | ||||||||||
| Capital Expenditure | ||||||||||
| UFCF | 719.3 | 1,401.5 | 1,635.7 | 1,545.7 | 1,684.3 | 1,775.7 | 1,863.2 | 1,954.7 | 2,050.7 | 2,151.4 |
| WACC, % | 6.14 | 6.23 | 6.35 | 6.58 | 6.2 | 6.3 | 6.3 | 6.3 | 6.3 | 6.3 |
| PV UFCF | ||||||||||
| SUM PV UFCF | 8,137.7 | |||||||||
| Long Term Growth Rate, % | 0.50 | |||||||||
| Free cash flow (T + 1) | 2,162 | |||||||||
| Terminal Value | 37,276 | |||||||||
| Present Terminal Value | 27,463 | |||||||||
| Enterprise Value | 35,601 | |||||||||
| Net Debt | 6,669 | |||||||||
| Equity Value | 28,932 | |||||||||
| Diluted Shares Outstanding, MM | 33 | |||||||||
| Equity Value Per Share | 882.17 |
What You Will Get
- Editable Forecast Inputs: Easily modify assumptions (growth %, margins, WACC) to explore various scenarios.
- Real-World Data: Nexstar Media Group, Inc.'s (NXST) financial data pre-filled to facilitate your analysis.
- Automatic DCF Outputs: The template computes Net Present Value (NPV) and intrinsic value for you.
- Customizable and Professional: A refined Excel model that adjusts to meet your valuation requirements.
- Built for Analysts and Investors: Perfect for evaluating projections, validating strategies, and enhancing efficiency.
Key Features
- 🔍 Real-Life NXST Financials: Pre-filled historical and projected data for Nexstar Media Group, Inc.
- ✏️ Fully Customizable Inputs: Adjust all critical parameters (yellow cells) like WACC, growth %, and tax rates.
- 📊 Professional DCF Valuation: Built-in formulas calculate Nexstar’s intrinsic value using the Discounted Cash Flow method.
- ⚡ Instant Results: Visualize Nexstar’s valuation instantly after making changes.
- Scenario Analysis: Test and compare outcomes for various financial assumptions side-by-side.
How It Works
- Download the Template: Gain immediate access to the Excel-based NXST DCF Calculator.
- Input Your Assumptions: Modify the yellow-highlighted cells for growth rates, WACC, margins, and more.
- Instant Calculations: The model automatically recalculates Nexstar Media Group's intrinsic value.
- Test Scenarios: Experiment with various assumptions to assess potential valuation shifts.
- Analyze and Decide: Utilize the results to inform your investment or financial analysis.
Why Choose This Calculator for Nexstar Media Group, Inc. (NXST)?
- Accuracy: Utilizes real Nexstar financials for precise data.
- Flexibility: Allows users to easily adjust and test various inputs.
- Time-Saving: Eliminate the need to create a DCF model from the ground up.
- Professional-Grade: Crafted with the expertise and usability expected at the CFO level.
- User-Friendly: Intuitive interface suitable for users with all levels of financial modeling experience.
Who Should Use This Product?
- Media Investors: Create comprehensive and dependable valuation models for analyzing Nexstar Media Group, Inc. (NXST) investments.
- Corporate Finance Teams: Evaluate valuation scenarios to inform strategic decisions within media operations.
- Consultants and Advisors: Deliver precise valuation insights for clients interested in Nexstar Media Group, Inc. (NXST).
- Students and Educators: Utilize real-world data to enhance learning and practice in financial modeling related to media companies.
- Media Industry Analysts: Gain insights into how companies like Nexstar Media Group, Inc. (NXST) are valued in the competitive media landscape.
What the Nexstar Template Contains
- Comprehensive DCF Model: Editable template featuring detailed valuation calculations for Nexstar Media Group.
- Real-World Data: Nexstar’s historical and projected financials preloaded for in-depth analysis.
- Customizable Parameters: Adjust WACC, growth rates, and tax assumptions to explore various scenarios.
- Financial Statements: Complete annual and quarterly breakdowns for enhanced insights into performance.
- Key Ratios: Integrated analysis for profitability, efficiency, and leverage metrics.
- Dashboard with Visual Outputs: Charts and tables designed for clear, actionable results regarding Nexstar Media Group, Inc. (NXST).
Disclaimer
All information, articles, and product details provided on this website are for general informational and educational purposes only. We do not claim any ownership over, nor do we intend to infringe upon, any trademarks, copyrights, logos, brand names, or other intellectual property mentioned or depicted on this site. Such intellectual property remains the property of its respective owners, and any references here are made solely for identification or informational purposes, without implying any affiliation, endorsement, or partnership.
We make no representations or warranties, express or implied, regarding the accuracy, completeness, or suitability of any content or products presented. Nothing on this website should be construed as legal, tax, investment, financial, medical, or other professional advice. In addition, no part of this site—including articles or product references—constitutes a solicitation, recommendation, endorsement, advertisement, or offer to buy or sell any securities, franchises, or other financial instruments, particularly in jurisdictions where such activity would be unlawful.
All content is of a general nature and may not address the specific circumstances of any individual or entity. It is not a substitute for professional advice or services. Any actions you take based on the information provided here are strictly at your own risk. You accept full responsibility for any decisions or outcomes arising from your use of this website and agree to release us from any liability in connection with your use of, or reliance upon, the content or products found herein.