
|
Alte nationale Bancorp (ONB) DCF -Bewertung |
Fully Editable: Tailor To Your Needs In Excel Or Sheets
Professional Design: Trusted, Industry-Standard Templates
Investor-Approved Valuation Models
MAC/PC Compatible, Fully Unlocked
No Expertise Is Needed; Easy To Follow
Old National Bancorp (ONB) Bundle
Entdecken Sie den wahren Wert von Old National Bancorp (ONB) mit unserem fortschrittlichen DCF -Taschenrechner! Passen Sie die wichtigsten Annahmen an, erkunden Sie verschiedene Szenarien und bewerten Sie die Auswirkungen von Änderungen auf die Bewertung des alten nationalen Bancorp (ONB) - alles innerhalb einer Excel -Vorlage.
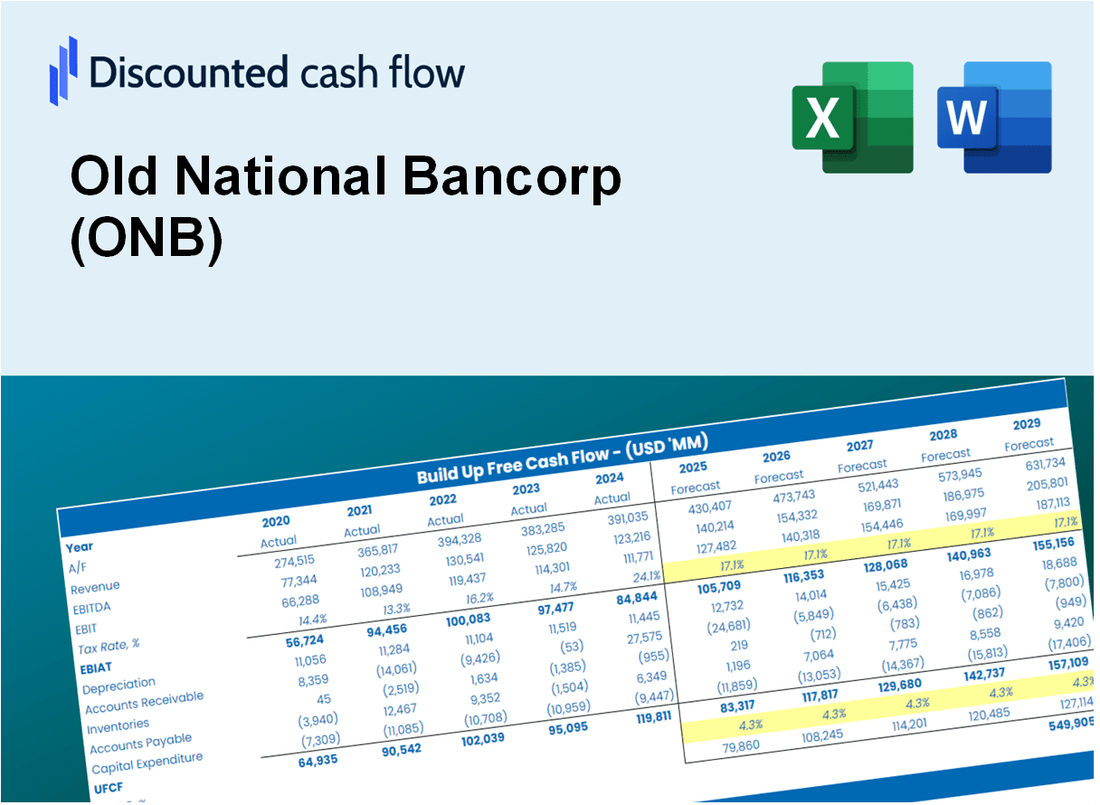
Discounted Cash Flow (DCF) - (USD MM)
| Year | AY1 2020 |
AY2 2021 |
AY3 2022 |
AY4 2023 |
AY5 2024 |
FY1 2025 |
FY2 2026 |
FY3 2027 |
FY4 2028 |
FY5 2029 |
|---|---|---|---|---|---|---|---|---|---|---|
| Revenue | 902.6 | 852.9 | 1,854.0 | 2,540.2 | 2,956.3 | 4,049.4 | 5,546.5 | 7,597.1 | 10,405.9 | 14,253.2 |
| Revenue Growth, % | 0 | -5.51 | 117.38 | 37.01 | 16.38 | 36.97 | 36.97 | 36.97 | 36.97 | 36.97 |
| EBITDA | 298.6 | 377.5 | 607.0 | 816.6 | 746.1 | 1,356.2 | 1,857.6 | 2,544.5 | 3,485.2 | 4,773.7 |
| EBITDA, % | 33.08 | 44.26 | 32.74 | 32.15 | 25.24 | 33.49 | 33.49 | 33.49 | 33.49 | 33.49 |
| Depreciation | 43.0 | 38.6 | 62.3 | 62.3 | 65.6 | 140.3 | 192.2 | 263.3 | 360.6 | 493.9 |
| Depreciation, % | 4.76 | 4.53 | 3.36 | 2.45 | 2.22 | 3.47 | 3.47 | 3.47 | 3.47 | 3.47 |
| EBIT | 255.6 | 338.9 | 544.7 | 754.2 | 680.4 | 1,215.9 | 1,665.5 | 2,281.2 | 3,124.6 | 4,279.8 |
| EBIT, % | 28.31 | 39.73 | 29.38 | 29.69 | 23.02 | 30.03 | 30.03 | 30.03 | 30.03 | 30.03 |
| Total Cash | 6,559.8 | 8,204.1 | 7,502.1 | 7,888.1 | 8,686.4 | 4,049.4 | 5,546.5 | 7,597.1 | 10,405.9 | 14,253.2 |
| Total Cash, percent | .0 | .0 | .0 | .0 | .0 | .0 | .0 | .0 | .0 | .0 |
| Account Receivables | 85.3 | 84.1 | 190.5 | .0 | .0 | 239.6 | 328.2 | 449.6 | 615.8 | 843.5 |
| Account Receivables, % | 9.45 | 9.86 | 10.28 | 0 | 0 | 5.92 | 5.92 | 5.92 | 5.92 | 5.92 |
| Inventories | .0 | .0 | .0 | .0 | .0 | .0 | .0 | .0 | .0 | .0 |
| Inventories, % | 0 | 0 | 0 | 0 | 0 | 0 | 0 | 0 | 0 | 0 |
| Accounts Payable | .0 | .0 | .0 | .0 | .0 | .0 | .0 | .0 | .0 | .0 |
| Accounts Payable, % | 0 | 0 | 0 | 0 | 0 | 0 | 0 | 0 | 0 | 0 |
| Capital Expenditure | -30.9 | -48.7 | -37.9 | -38.4 | -30.3 | -111.0 | -152.1 | -208.3 | -285.3 | -390.8 |
| Capital Expenditure, % | -3.42 | -5.71 | -2.04 | -1.51 | -1.02 | -2.74 | -2.74 | -2.74 | -2.74 | -2.74 |
| Tax Rate, % | 20.76 | 20.76 | 20.76 | 20.76 | 20.76 | 20.76 | 20.76 | 20.76 | 20.76 | 20.76 |
| EBITAT | 226.4 | 277.5 | 428.3 | 584.3 | 539.2 | 986.9 | 1,351.8 | 1,851.5 | 2,536.1 | 3,473.7 |
| Depreciation | ||||||||||
| Changes in Account Receivables | ||||||||||
| Changes in Inventories | ||||||||||
| Changes in Accounts Payable | ||||||||||
| Capital Expenditure | ||||||||||
| UFCF | 153.2 | 268.7 | 346.3 | 798.7 | 574.6 | 776.6 | 1,303.3 | 1,785.2 | 2,445.2 | 3,349.2 |
| WACC, % | 12.2 | 11.59 | 11.3 | 11.19 | 11.35 | 11.53 | 11.53 | 11.53 | 11.53 | 11.53 |
| PV UFCF | ||||||||||
| SUM PV UFCF | 6,552.3 | |||||||||
| Long Term Growth Rate, % | 2.00 | |||||||||
| Free cash flow (T + 1) | 3,416 | |||||||||
| Terminal Value | 35,853 | |||||||||
| Present Terminal Value | 20,778 | |||||||||
| Enterprise Value | 27,331 | |||||||||
| Net Debt | 4,184 | |||||||||
| Equity Value | 23,147 | |||||||||
| Diluted Shares Outstanding, MM | 311 | |||||||||
| Equity Value Per Share | 74.43 |
What You Will Get
- Real ONB Financials: Access to historical and projected data for precise valuation.
- Customizable Inputs: Adjust WACC, tax rates, revenue growth, and capital expenditures as needed.
- Dynamic Calculations: Intrinsic value and NPV are computed in real-time.
- Scenario Analysis: Explore various scenarios to assess Old National Bancorp's future performance.
- User-Friendly Design: Designed for professionals while remaining approachable for newcomers.
Key Features
- Customizable Financial Inputs: Adjust essential metrics such as loan growth, net interest margin, and operating expenses.
- Instant DCF Valuation: Quickly computes intrinsic value, NPV, and additional financial metrics.
- High-Precision Forecasting: Leverages Old National Bancorp’s actual financial data for accurate valuation results.
- Effortless Scenario Testing: Easily explore various assumptions and analyze results side by side.
- Efficiency Booster: Streamlines the valuation process, removing the need for intricate model development.
How It Works
- 1. Access the Model: Download and open the Excel file featuring Old National Bancorp’s (ONB) financial data.
- 2. Adjust Key Inputs: Modify essential parameters such as growth projections, WACC, and capital expenditures.
- 3. Analyze Results in Real-Time: The DCF model automatically computes intrinsic value and NPV based on your inputs.
- 4. Explore Different Scenarios: Evaluate various forecasts to understand a range of valuation possibilities.
- 5. Make Informed Decisions: Provide expert valuation insights to guide your financial strategies.
Why Choose This Calculator for Old National Bancorp (ONB)?
- Accurate Data: Up-to-date financials from Old National Bancorp ensure dependable valuation outcomes.
- Customizable: Tailor essential parameters such as growth rates, WACC, and tax rates to align with your forecasts.
- Time-Saving: Integrated calculations save you the effort of building from the ground up.
- Professional-Grade Tool: Crafted for investors, analysts, and financial consultants.
- User-Friendly: Easy-to-navigate design and clear instructions make it accessible for all users.
Who Should Use Old National Bancorp (ONB)?
- Investors: Gain insights and make informed decisions with a trusted banking partner.
- Financial Analysts: Utilize comprehensive financial reports and data for in-depth analysis.
- Consultants: Leverage Old National's resources for client strategies and solutions.
- Finance Enthusiasts: Explore banking services and investment opportunities to enhance your knowledge.
- Educators and Students: Incorporate real-world banking case studies into finance curricula.
What the Template Contains
- Comprehensive DCF Model: Editable template featuring in-depth valuation calculations.
- Real-World Data: Old National Bancorp’s (ONB) historical and projected financials preloaded for analysis.
- Customizable Parameters: Adjust WACC, growth rates, and tax assumptions to explore various scenarios.
- Financial Statements: Complete annual and quarterly breakdowns for enhanced insights.
- Key Ratios: Integrated analysis for profitability, efficiency, and leverage metrics.
- Dashboard with Visual Outputs: Charts and tables providing clear, actionable results.
Disclaimer
All information, articles, and product details provided on this website are for general informational and educational purposes only. We do not claim any ownership over, nor do we intend to infringe upon, any trademarks, copyrights, logos, brand names, or other intellectual property mentioned or depicted on this site. Such intellectual property remains the property of its respective owners, and any references here are made solely for identification or informational purposes, without implying any affiliation, endorsement, or partnership.
We make no representations or warranties, express or implied, regarding the accuracy, completeness, or suitability of any content or products presented. Nothing on this website should be construed as legal, tax, investment, financial, medical, or other professional advice. In addition, no part of this site—including articles or product references—constitutes a solicitation, recommendation, endorsement, advertisement, or offer to buy or sell any securities, franchises, or other financial instruments, particularly in jurisdictions where such activity would be unlawful.
All content is of a general nature and may not address the specific circumstances of any individual or entity. It is not a substitute for professional advice or services. Any actions you take based on the information provided here are strictly at your own risk. You accept full responsibility for any decisions or outcomes arising from your use of this website and agree to release us from any liability in connection with your use of, or reliance upon, the content or products found herein.