
|
Open Text Corporation (OTEX) DCF -Bewertung |
Fully Editable: Tailor To Your Needs In Excel Or Sheets
Professional Design: Trusted, Industry-Standard Templates
Investor-Approved Valuation Models
MAC/PC Compatible, Fully Unlocked
No Expertise Is Needed; Easy To Follow
Open Text Corporation (OTEX) Bundle
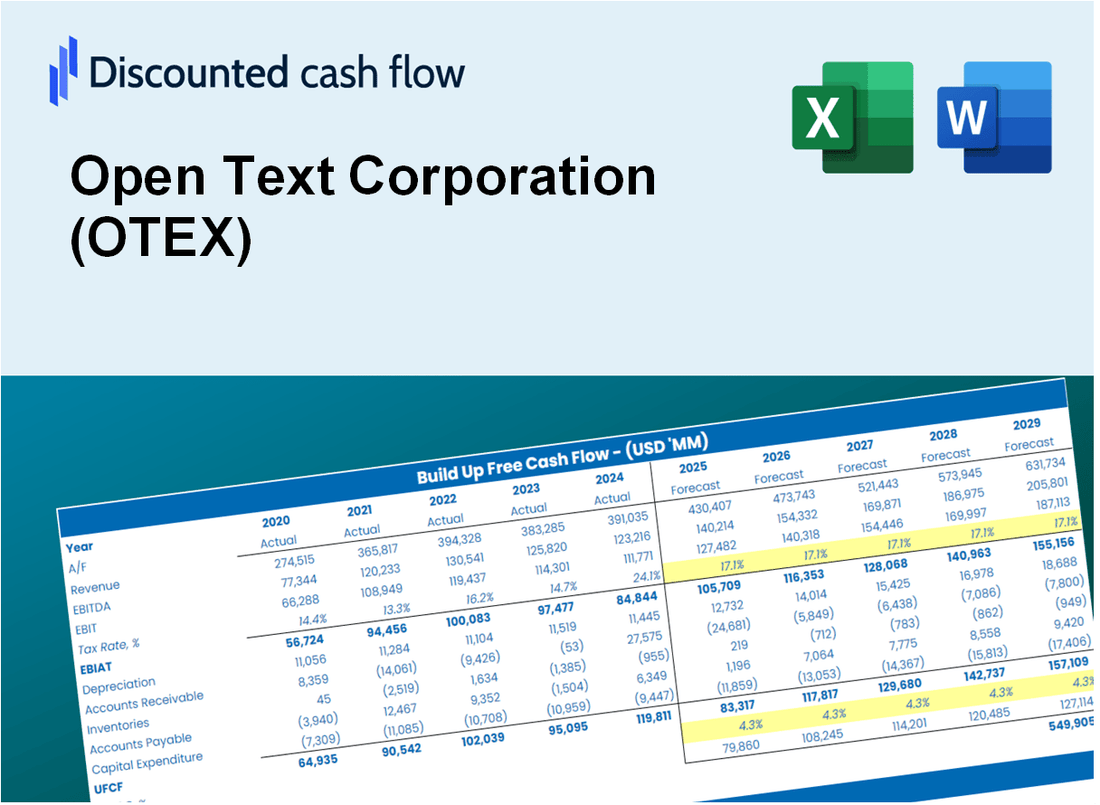
Unabhängig davon, ob Sie ein Investor oder Analyst sind, ist dieser DCF-Taschenrechner für Open Text Corporation (OTEX) Ihre Anlaufstelle für eine genaue Bewertung. Ausgestattet mit echten Daten von Open Text Corporation können Sie Prognosen anpassen und die Auswirkungen in Echtzeit beobachten.
What You Will Get
- Editable Forecast Inputs: Easily modify assumptions (growth %, margins, WACC) to develop various scenarios.
- Real-World Data: Open Text Corporation’s financial data pre-filled to kickstart your analysis.
- Automatic DCF Outputs: The template computes Net Present Value (NPV) and intrinsic value automatically.
- Customizable and Professional: A refined Excel model that adjusts to your valuation requirements.
- Built for Analysts and Investors: Perfect for evaluating projections, confirming strategies, and enhancing efficiency.
Key Features
- Comprehensive DCF Calculator: Features detailed unlevered and levered DCF valuation models tailored for Open Text Corporation (OTEX).
- WACC Calculator: Pre-configured Weighted Average Cost of Capital sheet with adjustable inputs specific to Open Text Corporation (OTEX).
- Customizable Forecast Assumptions: Adjust growth rates, capital expenditures, and discount rates to fit Open Text Corporation (OTEX) projections.
- Integrated Financial Ratios: Evaluate profitability, leverage, and efficiency ratios for Open Text Corporation (OTEX).
- Interactive Dashboard and Charts: Visual representations summarize essential valuation metrics for straightforward analysis of Open Text Corporation (OTEX).
How It Works
- Step 1: Download the Excel file.
- Step 2: Review pre-entered Open Text Corporation (OTEX) data (historical and projected).
- Step 3: Adjust key assumptions (yellow cells) based on your analysis.
- Step 4: View automatic recalculations for Open Text Corporation’s intrinsic value.
- Step 5: Use the outputs for investment decisions or reporting.
Why Choose This Calculator for Open Text Corporation (OTEX)?
- Accurate Data: Up-to-date Open Text financials provide trustworthy valuation outcomes.
- Customizable: Tailor essential inputs like growth rates, WACC, and tax rates to suit your forecasts.
- Time-Saving: Built-in calculations save you the hassle of starting from scratch.
- Professional-Grade Tool: Crafted for investors, analysts, and consultants focused on Open Text.
- User-Friendly: Easy-to-navigate design and clear, step-by-step guidance for all users.
Who Should Use This Product?
- Individual Investors: Make informed decisions about buying or selling Open Text Corporation (OTEX) stock.
- Financial Analysts: Streamline valuation processes with ready-to-use financial models for Open Text Corporation (OTEX).
- Consultants: Deliver professional valuation insights on Open Text Corporation (OTEX) to clients quickly and accurately.
- Business Owners: Understand how large companies like Open Text Corporation (OTEX) are valued to guide your own strategy.
- Finance Students: Learn valuation techniques using real-world data and scenarios involving Open Text Corporation (OTEX).
What the Template Contains
- Historical Data: Includes Open Text Corporation’s (OTEX) past financials and baseline forecasts.
- DCF and Levered DCF Models: Detailed templates to calculate Open Text Corporation’s (OTEX) intrinsic value.
- WACC Sheet: Pre-built calculations for Weighted Average Cost of Capital.
- Editable Inputs: Modify key drivers like growth rates, EBITDA %, and CAPEX assumptions.
- Quarterly and Annual Statements: A complete breakdown of Open Text Corporation’s (OTEX) financials.
- Interactive Dashboard: Visualize valuation results and projections dynamically.
Disclaimer
All information, articles, and product details provided on this website are for general informational and educational purposes only. We do not claim any ownership over, nor do we intend to infringe upon, any trademarks, copyrights, logos, brand names, or other intellectual property mentioned or depicted on this site. Such intellectual property remains the property of its respective owners, and any references here are made solely for identification or informational purposes, without implying any affiliation, endorsement, or partnership.
We make no representations or warranties, express or implied, regarding the accuracy, completeness, or suitability of any content or products presented. Nothing on this website should be construed as legal, tax, investment, financial, medical, or other professional advice. In addition, no part of this site—including articles or product references—constitutes a solicitation, recommendation, endorsement, advertisement, or offer to buy or sell any securities, franchises, or other financial instruments, particularly in jurisdictions where such activity would be unlawful.
All content is of a general nature and may not address the specific circumstances of any individual or entity. It is not a substitute for professional advice or services. Any actions you take based on the information provided here are strictly at your own risk. You accept full responsibility for any decisions or outcomes arising from your use of this website and agree to release us from any liability in connection with your use of, or reliance upon, the content or products found herein.