
|
Potbelly Corporation (PBPB) DCF -Bewertung |
Fully Editable: Tailor To Your Needs In Excel Or Sheets
Professional Design: Trusted, Industry-Standard Templates
Investor-Approved Valuation Models
MAC/PC Compatible, Fully Unlocked
No Expertise Is Needed; Easy To Follow
Potbelly Corporation (PBPB) Bundle
Vereinfachen Sie die Bewertung der Potbelly Corporation (PBPB) mit diesem anpassbaren DCF -Taschenrechner! Mit der Real Potbelly Corporation (PBPB) -Fonds und einstellbaren Prognoseeingaben können Sie Szenarien testen und die Fair -Wert der POBBelly Corporation (PBPB) in Minuten aufdecken.
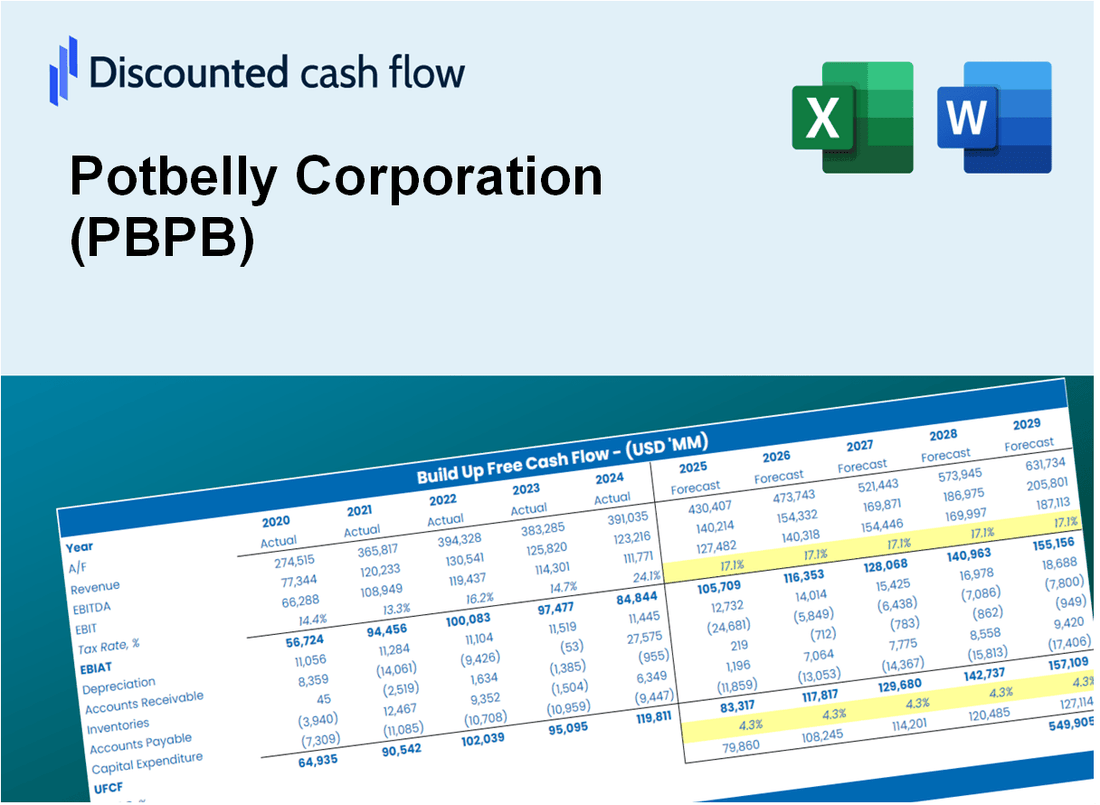
Discounted Cash Flow (DCF) - (USD MM)
| Year | AY1 2020 |
AY2 2021 |
AY3 2022 |
AY4 2023 |
AY5 2024 |
FY1 2025 |
FY2 2026 |
FY3 2027 |
FY4 2028 |
FY5 2029 |
|---|---|---|---|---|---|---|---|---|---|---|
| Revenue | 291.3 | 380.1 | 452.0 | 491.4 | 462.6 | 523.0 | 591.4 | 668.6 | 756.0 | 854.8 |
| Revenue Growth, % | 0 | 30.48 | 18.92 | 8.73 | -5.86 | 13.07 | 13.07 | 13.07 | 13.07 | 13.07 |
| EBITDA | -51.3 | -6.6 | 44.1 | 21.9 | 21.3 | -.6 | -.6 | -.7 | -.8 | -.9 |
| EBITDA, % | -17.61 | -1.73 | 9.75 | 4.46 | 4.6 | -0.10694 | -0.10694 | -0.10694 | -0.10694 | -0.10694 |
| Depreciation | 19.8 | 15.9 | 37.7 | 12.1 | 12.7 | 25.7 | 29.0 | 32.8 | 37.1 | 42.0 |
| Depreciation, % | 6.81 | 4.19 | 8.34 | 2.47 | 2.74 | 4.91 | 4.91 | 4.91 | 4.91 | 4.91 |
| EBIT | -71.1 | -22.5 | 6.4 | 9.8 | 8.6 | -26.2 | -29.7 | -33.5 | -37.9 | -42.9 |
| EBIT, % | -24.42 | -5.92 | 1.41 | 1.99 | 1.86 | -5.01 | -5.01 | -5.01 | -5.01 | -5.01 |
| Total Cash | 11.1 | 14.4 | 15.6 | 33.8 | 11.7 | 21.4 | 24.2 | 27.3 | 30.9 | 35.0 |
| Total Cash, percent | .0 | .0 | .0 | .0 | .0 | .0 | .0 | .0 | .0 | .0 |
| Account Receivables | 4.4 | 6.0 | 6.4 | 8.0 | 9.8 | 8.6 | 9.7 | 11.0 | 12.4 | 14.1 |
| Account Receivables, % | 1.49 | 1.59 | 1.42 | 1.62 | 2.11 | 1.65 | 1.65 | 1.65 | 1.65 | 1.65 |
| Inventories | 3.0 | 3.5 | 4.0 | 3.5 | 3.7 | 4.6 | 5.1 | 5.8 | 6.6 | 7.4 |
| Inventories, % | 1.03 | 0.91856 | 0.8828 | 0.71549 | 0.80934 | 0.87047 | 0.87047 | 0.87047 | 0.87047 | 0.87047 |
| Accounts Payable | 7.5 | 8.1 | 10.7 | 9.9 | 9.6 | 11.7 | 13.2 | 14.9 | 16.9 | 19.1 |
| Accounts Payable, % | 2.58 | 2.14 | 2.37 | 2.02 | 2.06 | 2.24 | 2.24 | 2.24 | 2.24 | 2.24 |
| Capital Expenditure | -10.9 | -9.0 | -8.4 | -17.1 | -19.3 | -16.4 | -18.5 | -20.9 | -23.6 | -26.7 |
| Capital Expenditure, % | -3.75 | -2.38 | -1.86 | -3.47 | -4.17 | -3.13 | -3.13 | -3.13 | -3.13 | -3.13 |
| Tax Rate, % | -417.45 | -417.45 | -417.45 | -417.45 | -417.45 | -417.45 | -417.45 | -417.45 | -417.45 | -417.45 |
| EBITAT | -64.7 | -22.8 | 5.5 | 7.7 | 44.6 | -23.9 | -27.1 | -30.6 | -34.6 | -39.1 |
| Depreciation | ||||||||||
| Changes in Account Receivables | ||||||||||
| Changes in Inventories | ||||||||||
| Changes in Accounts Payable | ||||||||||
| Capital Expenditure | ||||||||||
| UFCF | -55.6 | -17.5 | 36.5 | .9 | 35.6 | -12.1 | -16.7 | -18.9 | -21.4 | -24.2 |
| WACC, % | 9.19 | 9.26 | 9.15 | 9.09 | 9.26 | 9.19 | 9.19 | 9.19 | 9.19 | 9.19 |
| PV UFCF | ||||||||||
| SUM PV UFCF | -70.2 | |||||||||
| Long Term Growth Rate, % | 0.50 | |||||||||
| Free cash flow (T + 1) | -24 | |||||||||
| Terminal Value | -279 | |||||||||
| Present Terminal Value | -180 | |||||||||
| Enterprise Value | -250 | |||||||||
| Net Debt | 143 | |||||||||
| Equity Value | -393 | |||||||||
| Diluted Shares Outstanding, MM | 31 | |||||||||
| Equity Value Per Share | -12.80 |
What You Will Receive
- Customizable Excel Template: A fully adjustable Excel-based DCF Calculator featuring pre-loaded financial data for Potbelly Corporation (PBPB).
- Authentic Data: Access to historical figures and forward-looking projections (highlighted in the yellow cells).
- Adjustable Forecasts: Modify forecast parameters such as revenue growth, EBITDA %, and WACC.
- Instant Calculations: Quickly observe how your inputs affect Potbelly’s valuation.
- Professional Resource: Designed for investors, CFOs, consultants, and financial analysts.
- Intuitive Layout: Organized for clarity and simplicity, complete with step-by-step guidance.
Key Features
- Comprehensive DCF Calculator: Features detailed unlevered and levered DCF valuation models tailored for Potbelly Corporation (PBPB).
- WACC Calculator: Pre-configured Weighted Average Cost of Capital sheet with adjustable inputs for your convenience.
- Customizable Forecast Assumptions: Easily alter growth rates, capital expenditures, and discount rates to fit your analysis.
- Integrated Financial Ratios: Evaluate profitability, leverage, and efficiency ratios specifically for Potbelly Corporation (PBPB).
- Interactive Dashboard and Charts: Visual representations that summarize essential valuation metrics for straightforward analysis.
How It Works
- Download: Obtain the pre-built Excel file featuring Potbelly Corporation's (PBPB) financial data.
- Customize: Modify projections, including sales growth, EBITDA margin, and discount rate.
- Update Automatically: The intrinsic value and NPV calculations refresh in real-time.
- Test Scenarios: Develop various forecasts and evaluate results instantly.
- Make Decisions: Utilize the valuation insights to shape your investment approach.
Why Choose Potbelly's Financial Calculator?
- All-in-One Solution: Features DCF, WACC, and financial ratio analyses tailored for Potbelly Corporation (PBPB).
- Flexible Inputs: Modify the yellow-highlighted cells to explore different financial scenarios.
- In-Depth Analysis: Automatically computes Potbelly’s intrinsic value and Net Present Value.
- Preloaded Information: Includes historical and projected data for precise calculations.
- High-Quality Standards: Perfect for financial analysts, investors, and business advisors focused on Potbelly Corporation (PBPB).
Who Should Use Potbelly Corporation (PBPB)?
- Food Enthusiasts: Discover and enjoy a diverse menu of sandwiches and salads crafted with quality ingredients.
- Franchise Owners: Leverage a proven business model with strong brand recognition and support.
- Health-Conscious Consumers: Explore nutritious options that cater to a variety of dietary preferences.
- Investors: Analyze the growth potential of a company committed to enhancing the customer experience.
- Families: Enjoy a welcoming atmosphere perfect for casual dining and gatherings.
What the Template Contains
- Historical Data: Includes Potbelly Corporation’s past financials and baseline forecasts.
- DCF and Levered DCF Models: Detailed templates to calculate Potbelly Corporation’s intrinsic value.
- WACC Sheet: Pre-built calculations for Weighted Average Cost of Capital.
- Editable Inputs: Modify key drivers like growth rates, EBITDA %, and CAPEX assumptions.
- Quarterly and Annual Statements: A complete breakdown of Potbelly Corporation’s financials.
- Interactive Dashboard: Visualize valuation results and projections dynamically.
Disclaimer
All information, articles, and product details provided on this website are for general informational and educational purposes only. We do not claim any ownership over, nor do we intend to infringe upon, any trademarks, copyrights, logos, brand names, or other intellectual property mentioned or depicted on this site. Such intellectual property remains the property of its respective owners, and any references here are made solely for identification or informational purposes, without implying any affiliation, endorsement, or partnership.
We make no representations or warranties, express or implied, regarding the accuracy, completeness, or suitability of any content or products presented. Nothing on this website should be construed as legal, tax, investment, financial, medical, or other professional advice. In addition, no part of this site—including articles or product references—constitutes a solicitation, recommendation, endorsement, advertisement, or offer to buy or sell any securities, franchises, or other financial instruments, particularly in jurisdictions where such activity would be unlawful.
All content is of a general nature and may not address the specific circumstances of any individual or entity. It is not a substitute for professional advice or services. Any actions you take based on the information provided here are strictly at your own risk. You accept full responsibility for any decisions or outcomes arising from your use of this website and agree to release us from any liability in connection with your use of, or reliance upon, the content or products found herein.