
|
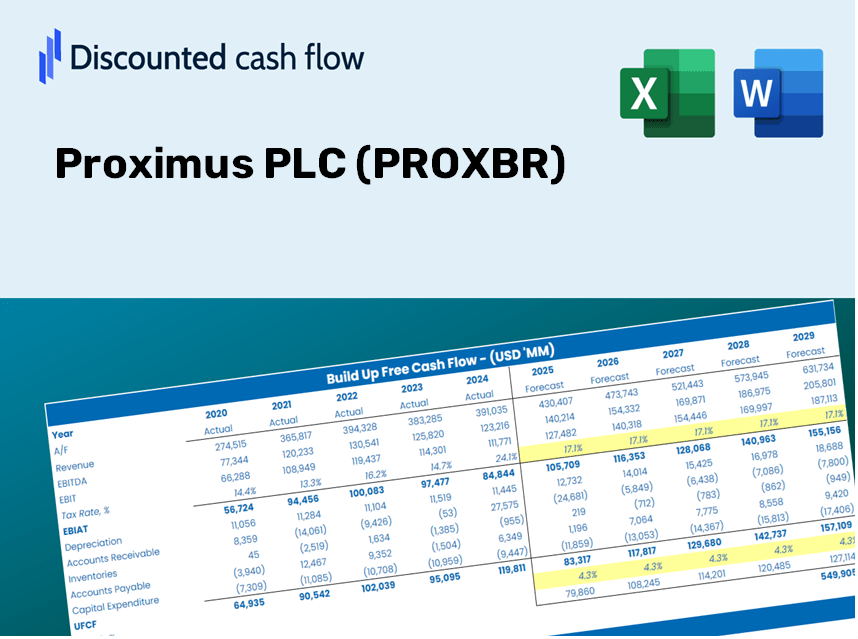
Proximus plc (Prox.br) DCF -Bewertung |
Fully Editable: Tailor To Your Needs In Excel Or Sheets
Professional Design: Trusted, Industry-Standard Templates
Investor-Approved Valuation Models
MAC/PC Compatible, Fully Unlocked
No Expertise Is Needed; Easy To Follow
Proximus PLC (PROX.BR) Bundle
Verbessern Sie Ihre Anlagestrategie mit dem Proximus plc (Proxbr) DCF -Taschenrechner! Erforschen Sie reale Finanzdaten, passen Sie Wachstumsprojektionen und -kosten an und beobachten Sie sofort, wie diese Modifikationen den inneren Wert von Proximus plc (Proxbr) beeinflussen.
What You Will Receive
- Accurate PROXBR Financials: Access to both historical and projected data for precise valuation.
- Customizable Inputs: Adjust WACC, tax rates, revenue growth, and capital expenditures to fit your analysis.
- Real-Time Calculations: Dynamic computation of intrinsic value and NPV.
- Scenario Planning: Explore various scenarios to assess Proximus PLC's future performance.
- User-Friendly Design: Tailored for experts, yet easy to use for newcomers.
Key Features
- Authentic Proximus Financial Data: Gain access to reliable pre-loaded historical figures and future forecasts.
- Customizable Forecast Parameters: Modify the yellow-highlighted cells including WACC, growth rates, and margins to suit your analysis.
- Real-Time Calculations: Enjoy automatic updates for DCF, Net Present Value (NPV), and cash flow assessments.
- User-Friendly Dashboard: View intuitive charts and summaries to easily interpret your valuation outcomes.
- Designed for All Experience Levels: A straightforward, intuitive layout tailored for investors, CFOs, and consultants alike.
How It Operates
- Download the Template: Gain immediate access to the Excel-based PROXBR DCF Calculator.
- Input Your Assumptions: Modify the yellow-highlighted fields to set growth rates, WACC, margins, and more.
- Instant Calculations: The model automatically updates Proximus PLC’s intrinsic value.
- Test Scenarios: Experiment with various assumptions to assess potential changes in valuation.
- Analyze and Decide: Utilize the results to inform your investment or financial strategies.
Why Choose This Calculator for Proximus PLC (PROXBR)?
- Designed for Experts: A sophisticated tool tailored for analysts, CFOs, and consultants.
- Accurate Financial Data: Historical and projected financial information for Proximus PLC preloaded for precision.
- Forecast Scenarios: Effortlessly test various projections and assumptions.
- Transparent Results: Automatically generates intrinsic value, NPV, and essential metrics.
- User-Friendly: Comprehensive step-by-step guidance throughout the process.
Who Should Utilize This Product?
- Investors: Precisely evaluate Proximus PLC’s (PROXBR) fair value prior to making investment choices.
- CFOs: Utilize a high-quality DCF model for thorough financial reporting and analysis.
- Consultants: Efficiently customize the template for client valuation reports.
- Entrepreneurs: Discover financial modeling strategies employed by leading companies.
- Educators: Apply it as a resource for teaching valuation techniques.
Contents of the Template
- Comprehensive DCF Model: An editable template featuring in-depth valuation calculations.
- Real-World Data: Proximus PLC’s (PROXBR) historical and projected financials preloaded for comprehensive analysis.
- Customizable Parameters: Modify WACC, growth rates, and tax assumptions to simulate various scenarios.
- Financial Statements: Detailed annual and quarterly breakdowns for enhanced insights.
- Key Ratios: Integrated analysis covering profitability, efficiency, and leverage metrics.
- Dashboard with Visual Outputs: Charts and tables for easily interpretable, actionable results.
Disclaimer
All information, articles, and product details provided on this website are for general informational and educational purposes only. We do not claim any ownership over, nor do we intend to infringe upon, any trademarks, copyrights, logos, brand names, or other intellectual property mentioned or depicted on this site. Such intellectual property remains the property of its respective owners, and any references here are made solely for identification or informational purposes, without implying any affiliation, endorsement, or partnership.
We make no representations or warranties, express or implied, regarding the accuracy, completeness, or suitability of any content or products presented. Nothing on this website should be construed as legal, tax, investment, financial, medical, or other professional advice. In addition, no part of this site—including articles or product references—constitutes a solicitation, recommendation, endorsement, advertisement, or offer to buy or sell any securities, franchises, or other financial instruments, particularly in jurisdictions where such activity would be unlawful.
All content is of a general nature and may not address the specific circumstances of any individual or entity. It is not a substitute for professional advice or services. Any actions you take based on the information provided here are strictly at your own risk. You accept full responsibility for any decisions or outcomes arising from your use of this website and agree to release us from any liability in connection with your use of, or reliance upon, the content or products found herein.