
|
Regeneron Pharmaceuticals, Inc. (Regn) DCF -Bewertung |
Fully Editable: Tailor To Your Needs In Excel Or Sheets
Professional Design: Trusted, Industry-Standard Templates
Investor-Approved Valuation Models
MAC/PC Compatible, Fully Unlocked
No Expertise Is Needed; Easy To Follow
Regeneron Pharmaceuticals, Inc. (REGN) Bundle
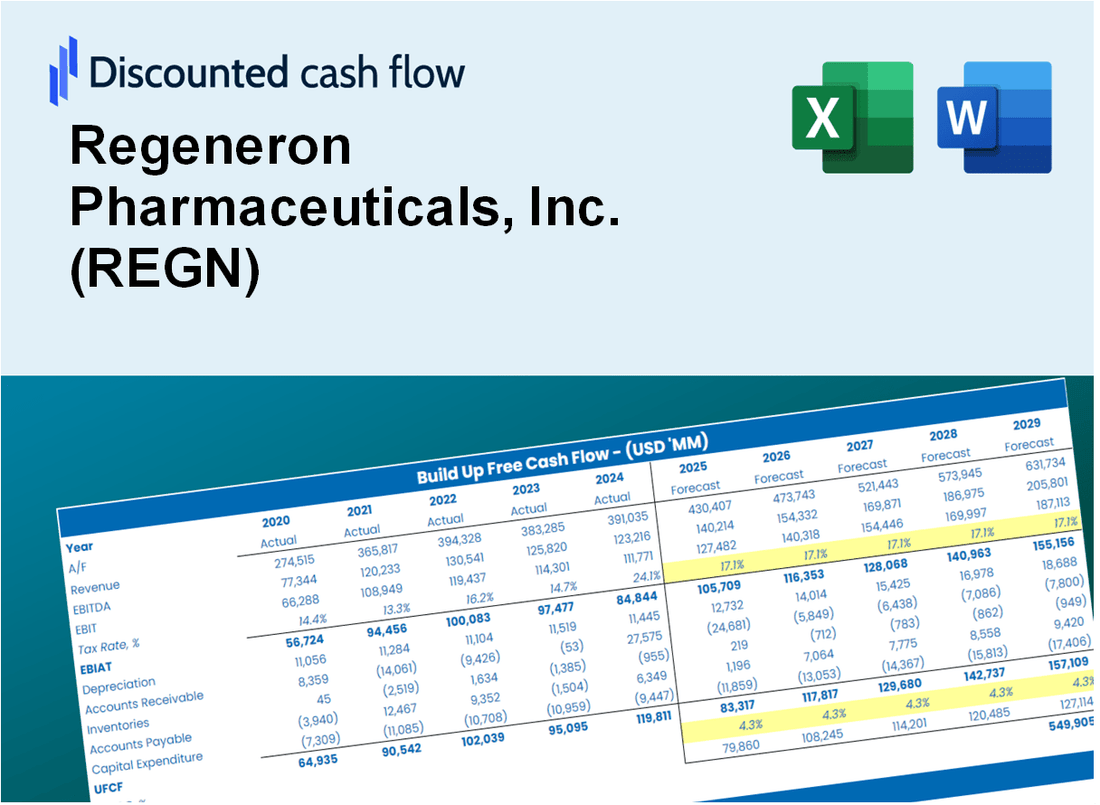
Verbessern Sie Ihre REGENERON PHARMACEUMS, INC. (REGN) -Schanganalyse unter Verwendung unseres DCF-Taschenrechners des hochmodernen DCF! Diese Excel -Vorlage wird mit realen (RELN-) Daten vorgeladen, sodass Sie Prognosen und Annahmen anpassen können, um den inneren Wert von Regeneron Pharmaceuticals, Inc. genau zu bestimmen.
What You Will Get
- Comprehensive REGN Financials: Access both historical and projected data for precise valuation.
- Customizable Inputs: Adjust WACC, tax rates, revenue growth, and capital expenditures as needed.
- Dynamic Calculations: Intrinsic value and NPV are computed in real-time.
- Scenario Analysis: Explore various scenarios to assess Regeneron's future performance.
- User-Friendly Interface: Designed for professionals but easy enough for newcomers to navigate.
Key Features
- Comprehensive DCF Calculator: Features in-depth unlevered and levered DCF valuation models tailored for Regeneron Pharmaceuticals, Inc. (REGN).
- WACC Calculator: Pre-configured Weighted Average Cost of Capital sheet with adjustable parameters specific to the biotech industry.
- Customizable Forecast Assumptions: Easily adjust growth rates, capital expenditures, and discount rates to fit Regeneron's financial outlook.
- Integrated Financial Ratios: Evaluate profitability, leverage, and efficiency ratios relevant to Regeneron Pharmaceuticals, Inc. (REGN).
- Interactive Dashboard and Charts: Visual representations of key valuation metrics facilitate straightforward analysis for investors.
How It Works
- Download: Get the comprehensive Excel file containing Regeneron Pharmaceuticals' financial data.
- Customize: Modify projections such as revenue growth, EBITDA %, and WACC to suit your analysis.
- Update Automatically: The intrinsic value and NPV calculations refresh in real-time as you make changes.
- Test Scenarios: Generate various forecasts and immediately compare the results.
- Make Decisions: Leverage the valuation insights to inform your investment choices.
Why Choose This Calculator?
- Accuracy: Utilizes real Regeneron financials for precise data.
- Flexibility: Allows users to easily test and adjust inputs as needed.
- Time-Saving: Eliminate the need to create a DCF model from the ground up.
- Professional-Grade: Crafted with the expertise and usability expected at the CFO level.
- User-Friendly: Intuitive interface suitable for users without extensive financial modeling skills.
Who Should Use This Product?
- Professional Investors: Develop comprehensive and accurate valuation models for portfolio management of Regeneron Pharmaceuticals, Inc. (REGN).
- Corporate Finance Teams: Evaluate valuation scenarios to inform strategic decisions within their organizations.
- Consultants and Advisors: Deliver precise valuation insights for clients interested in Regeneron Pharmaceuticals, Inc. (REGN).
- Students and Educators: Utilize real-world data to enhance learning and practice in financial modeling.
- Biotech Enthusiasts: Gain a deeper understanding of how biotech firms like Regeneron Pharmaceuticals, Inc. (REGN) are assessed in the market.
What the Template Contains
- Pre-Filled Data: Includes Regeneron Pharmaceuticals' historical financials and forecasts.
- Discounted Cash Flow Model: Editable DCF valuation model with automatic calculations.
- Weighted Average Cost of Capital (WACC): A dedicated sheet for calculating WACC based on custom inputs.
- Key Financial Ratios: Analyze Regeneron Pharmaceuticals' profitability, efficiency, and leverage.
- Customizable Inputs: Edit revenue growth, margins, and tax rates with ease.
- Clear Dashboard: Charts and tables summarizing key valuation results.
Disclaimer
All information, articles, and product details provided on this website are for general informational and educational purposes only. We do not claim any ownership over, nor do we intend to infringe upon, any trademarks, copyrights, logos, brand names, or other intellectual property mentioned or depicted on this site. Such intellectual property remains the property of its respective owners, and any references here are made solely for identification or informational purposes, without implying any affiliation, endorsement, or partnership.
We make no representations or warranties, express or implied, regarding the accuracy, completeness, or suitability of any content or products presented. Nothing on this website should be construed as legal, tax, investment, financial, medical, or other professional advice. In addition, no part of this site—including articles or product references—constitutes a solicitation, recommendation, endorsement, advertisement, or offer to buy or sell any securities, franchises, or other financial instruments, particularly in jurisdictions where such activity would be unlawful.
All content is of a general nature and may not address the specific circumstances of any individual or entity. It is not a substitute for professional advice or services. Any actions you take based on the information provided here are strictly at your own risk. You accept full responsibility for any decisions or outcomes arising from your use of this website and agree to release us from any liability in connection with your use of, or reliance upon, the content or products found herein.