
|
Smartsheet Inc. (SMAR) DCF -Bewertung |
Fully Editable: Tailor To Your Needs In Excel Or Sheets
Professional Design: Trusted, Industry-Standard Templates
Investor-Approved Valuation Models
MAC/PC Compatible, Fully Unlocked
No Expertise Is Needed; Easy To Follow
Smartsheet Inc. (SMAR) Bundle
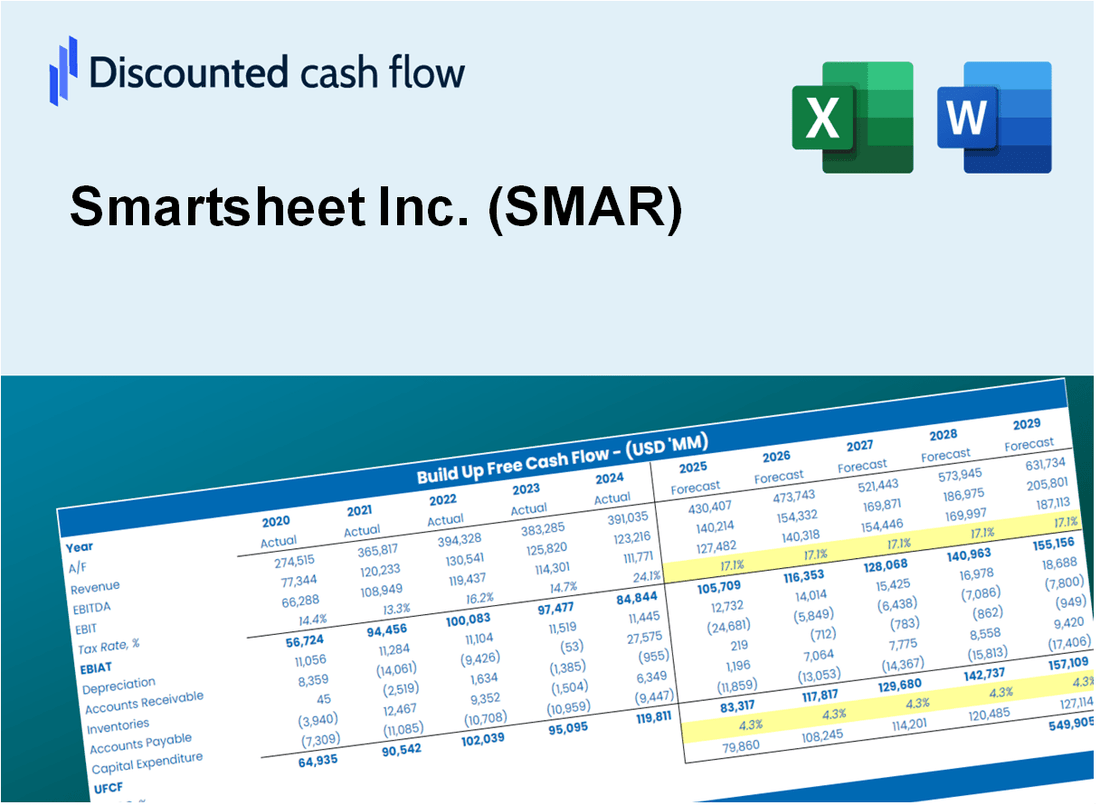
Gewinnen Sie Einblicke in Ihre SMAR-Bewertungsanalyse in Smartsheet Inc. (SMAR) unter Verwendung unseres hochmodernen DCF-Taschenrechners! Diese Excel -Vorlage wird mit realen (SMAR-) Daten vorinstalliert, sodass Sie Prognosen und Annahmen anpassen können, um den inneren Wert von Smartsheet Inc. genau zu bestimmen.
Discounted Cash Flow (DCF) - (USD MM)
| Year | AY1 2020 |
AY2 2021 |
AY3 2022 |
AY4 2023 |
AY5 2024 |
FY1 2025 |
FY2 2026 |
FY3 2027 |
FY4 2028 |
FY5 2029 |
|---|---|---|---|---|---|---|---|---|---|---|
| Revenue | 270.9 | 385.5 | 550.8 | 766.9 | 958.3 | 1,316.3 | 1,807.8 | 2,483.0 | 3,410.4 | 4,684.0 |
| Revenue Growth, % | 0 | 42.32 | 42.88 | 39.23 | 24.96 | 37.35 | 37.35 | 37.35 | 37.35 | 37.35 |
| EBITDA | -90.3 | -103.2 | -148.3 | -196.8 | -93.3 | -322.3 | -442.7 | -608.0 | -835.0 | -1,146.9 |
| EBITDA, % | -33.34 | -26.77 | -26.92 | -25.66 | -9.73 | -24.49 | -24.49 | -24.49 | -24.49 | -24.49 |
| Depreciation | 21.4 | 29.2 | 36.7 | 42.9 | 26.0 | 80.1 | 110.1 | 151.2 | 207.7 | 285.2 |
| Depreciation, % | 7.91 | 7.57 | 6.66 | 5.6 | 2.72 | 6.09 | 6.09 | 6.09 | 6.09 | 6.09 |
| EBIT | -111.7 | -132.4 | -184.9 | -239.7 | -119.3 | -402.4 | -552.7 | -759.2 | -1,042.7 | -1,432.1 |
| EBIT, % | -41.25 | -34.34 | -33.57 | -31.26 | -12.45 | -30.57 | -30.57 | -30.57 | -30.57 | -30.57 |
| Total Cash | 566.5 | 442.2 | 449.1 | 456.4 | 628.8 | 1,070.5 | 1,470.3 | 2,019.4 | 2,773.6 | 3,809.5 |
| Total Cash, percent | .0 | .0 | .0 | .0 | .0 | .0 | .0 | .0 | .0 | .0 |
| Account Receivables | 56.9 | 102.6 | 151.1 | 198.6 | 238.7 | 331.3 | 455.1 | 625.1 | 858.5 | 1,179.1 |
| Account Receivables, % | 20.99 | 26.63 | 27.44 | 25.9 | 24.91 | 25.17 | 25.17 | 25.17 | 25.17 | 25.17 |
| Inventories | .0 | .0 | .0 | .0 | .0 | .0 | .0 | .0 | .0 | .0 |
| Inventories, % | 0 | 0.000000259 | 0.000000182 | 0.00000013 | 0 | 0.000000114 | 0.000000114 | 0.000000114 | 0.000000114 | 0.000000114 |
| Accounts Payable | 7.7 | 2.9 | 1.5 | 2.1 | 2.9 | 11.7 | 16.1 | 22.1 | 30.3 | 41.7 |
| Accounts Payable, % | 2.85 | 0.73953 | 0.2734 | 0.27708 | 0.30647 | 0.88929 | 0.88929 | 0.88929 | 0.88929 | 0.88929 |
| Capital Expenditure | -11.9 | -11.8 | -17.3 | -13.8 | -13.3 | -36.2 | -49.8 | -68.4 | -93.9 | -128.9 |
| Capital Expenditure, % | -4.38 | -3.06 | -3.14 | -1.8 | -1.39 | -2.75 | -2.75 | -2.75 | -2.75 | -2.75 |
| Tax Rate, % | -8.83 | -8.83 | -8.83 | -8.83 | -8.83 | -8.83 | -8.83 | -8.83 | -8.83 | -8.83 |
| EBITAT | -111.9 | -128.2 | -185.3 | -242.9 | -129.8 | -399.9 | -549.2 | -754.4 | -1,036.1 | -1,423.1 |
| Depreciation | ||||||||||
| Changes in Account Receivables | ||||||||||
| Changes in Inventories | ||||||||||
| Changes in Accounts Payable | ||||||||||
| Capital Expenditure | ||||||||||
| UFCF | -151.5 | -161.5 | -215.7 | -260.7 | -156.4 | -439.8 | -608.3 | -835.5 | -1,147.5 | -1,576.1 |
| WACC, % | 7.94 | 7.94 | 7.94 | 7.94 | 7.94 | 7.94 | 7.94 | 7.94 | 7.94 | 7.94 |
| PV UFCF | ||||||||||
| SUM PV UFCF | -3,514.6 | |||||||||
| Long Term Growth Rate, % | 2.00 | |||||||||
| Free cash flow (T + 1) | -1,608 | |||||||||
| Terminal Value | -27,050 | |||||||||
| Present Terminal Value | -18,458 | |||||||||
| Enterprise Value | -21,973 | |||||||||
| Net Debt | -232 | |||||||||
| Equity Value | -21,741 | |||||||||
| Diluted Shares Outstanding, MM | 135 | |||||||||
| Equity Value Per Share | -161.63 |
What You Will Receive
- Accurate SMAR Financial Data: Pre-loaded with Smartsheet’s historical and forecasted data for thorough analysis.
- Customizable Template: Easily adjust key metrics such as revenue growth, WACC, and EBITDA %.
- Instant Calculations: Observe Smartsheet’s intrinsic value update in real-time based on your modifications.
- Expert Valuation Tool: Tailored for investors, analysts, and consultants aiming for precise DCF outcomes.
- Intuitive Design: Straightforward layout and clear guidelines suitable for all skill levels.
Key Features
- 🔍 Real-Life SMAR Financials: Pre-filled historical and projected data for Smartsheet Inc.
- ✏️ Fully Customizable Inputs: Adjust all critical parameters (yellow cells) like WACC, growth %, and tax rates.
- 📊 Professional DCF Valuation: Built-in formulas calculate Smartsheet’s intrinsic value using the Discounted Cash Flow method.
- ⚡ Instant Results: Visualize Smartsheet’s valuation instantly after making changes.
- Scenario Analysis: Test and compare outcomes for various financial assumptions side-by-side.
How It Works
- Download: Get the pre-built Excel file featuring Smartsheet Inc.'s (SMAR) financial data.
- Customize: Modify projections, such as revenue growth, EBITDA %, and WACC.
- Update Automatically: The intrinsic value and NPV calculations refresh in real-time.
- Test Scenarios: Develop various projections and instantly compare results.
- Make Decisions: Leverage the valuation insights to inform your investment approach.
Why Choose This Smartsheet Calculator?
- All-in-One Solution: Combines project management metrics, resource allocation, and financial projections seamlessly.
- Flexible Configurations: Modify highlighted fields to explore different project scenarios and outcomes.
- In-Depth Analysis: Automatically computes Smartsheet’s (SMAR) market potential and ROI.
- Preloaded Information: Access to historical performance data and future estimates for reliable analysis.
- Expert-Level Tool: Perfect for project managers, analysts, and business strategists.
Who Should Use Smartsheet Inc. (SMAR)?
- Project Managers: Utilize Smartsheet to enhance project tracking and collaboration.
- Team Leaders: Streamline team workflows and improve productivity with customizable templates.
- Business Analysts: Analyze project data and generate reports to inform strategic decisions.
- Marketing Professionals: Manage campaigns and track performance metrics in real-time.
- IT Departments: Integrate Smartsheet into existing systems for better resource management.
What the Template Contains
- Comprehensive DCF Model: Editable template featuring detailed valuation calculations.
- Real-World Data: Smartsheet Inc.’s (SMAR) historical and projected financials preloaded for analysis.
- Customizable Parameters: Modify WACC, growth rates, and tax assumptions to explore different scenarios.
- Financial Statements: Complete annual and quarterly breakdowns for enhanced insights.
- Key Ratios: Integrated analysis for profitability, efficiency, and leverage metrics.
- Dashboard with Visual Outputs: Charts and tables presenting clear, actionable results.
Disclaimer
All information, articles, and product details provided on this website are for general informational and educational purposes only. We do not claim any ownership over, nor do we intend to infringe upon, any trademarks, copyrights, logos, brand names, or other intellectual property mentioned or depicted on this site. Such intellectual property remains the property of its respective owners, and any references here are made solely for identification or informational purposes, without implying any affiliation, endorsement, or partnership.
We make no representations or warranties, express or implied, regarding the accuracy, completeness, or suitability of any content or products presented. Nothing on this website should be construed as legal, tax, investment, financial, medical, or other professional advice. In addition, no part of this site—including articles or product references—constitutes a solicitation, recommendation, endorsement, advertisement, or offer to buy or sell any securities, franchises, or other financial instruments, particularly in jurisdictions where such activity would be unlawful.
All content is of a general nature and may not address the specific circumstances of any individual or entity. It is not a substitute for professional advice or services. Any actions you take based on the information provided here are strictly at your own risk. You accept full responsibility for any decisions or outcomes arising from your use of this website and agree to release us from any liability in connection with your use of, or reliance upon, the content or products found herein.