
|
Southern State Bancshares, Inc. (SSBK) DCF -Bewertung |
Fully Editable: Tailor To Your Needs In Excel Or Sheets
Professional Design: Trusted, Industry-Standard Templates
Investor-Approved Valuation Models
MAC/PC Compatible, Fully Unlocked
No Expertise Is Needed; Easy To Follow
Southern States Bancshares, Inc. (SSBK) Bundle
Stürzen Sie Ihre Analyse und verbessern Sie die Präzision mit unserem (SSBK) DCF -Taschenrechner! Mit realen Daten aus Southern State Bancshares, Inc. und anpassbaren Annahmen ermöglichen dieses Tool Sie, wie ein erfahrener Investor prognostiziert, analysieren und value (SSBK).
What You Will Receive
- Customizable Excel Template: A fully editable Excel-based DCF Calculator featuring pre-filled real SSBK financials.
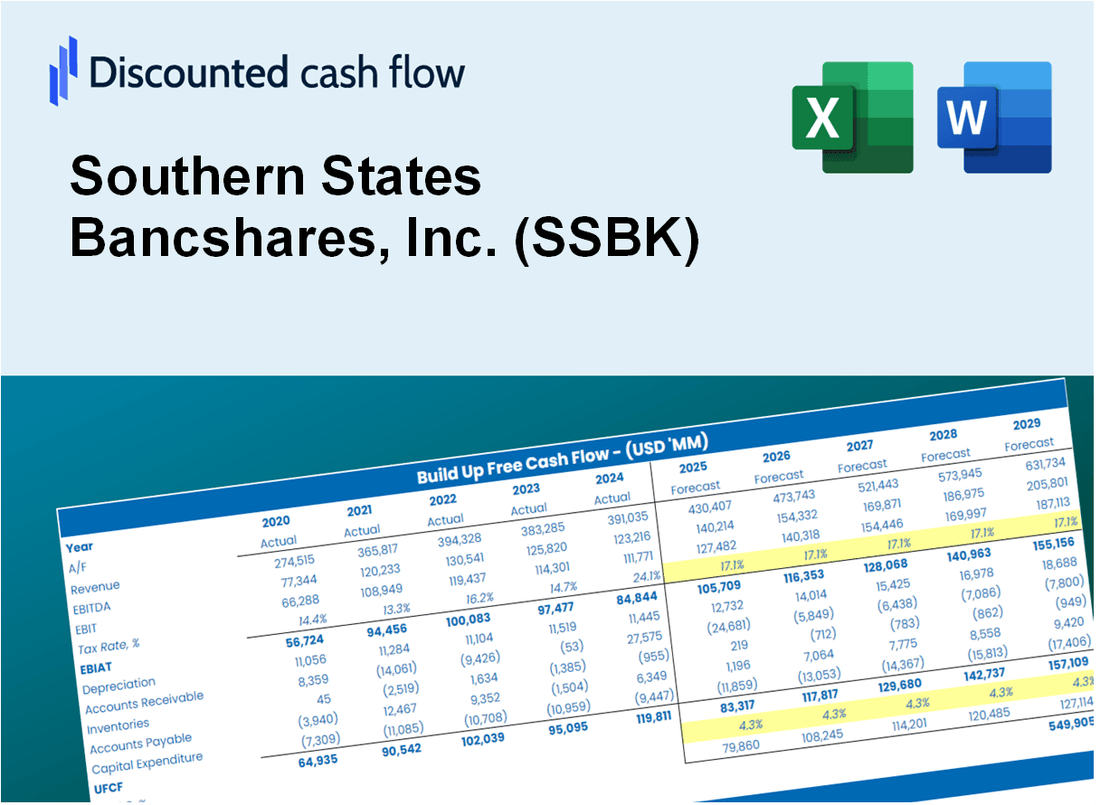
- Actual Data Insights: Historical performance data and forward-looking projections (highlighted in the yellow cells).
- Flexible Forecasting: Adjust forecast parameters such as revenue growth, EBITDA %, and WACC.
- Instant Calculations: Quickly observe how your inputs affect Southern States Bancshares' valuation.
- Professional Resource: Designed for investors, CFOs, consultants, and financial analysts.
- Intuitive Layout: Organized for clarity and ease of navigation, complete with step-by-step guidance.
Key Features
- Real-Life SSBK Data: Pre-filled with Southern States Bancshares’ historical financials and future projections.
- Fully Customizable Inputs: Modify revenue growth, profit margins, WACC, tax rates, and capital expenditures as needed.
- Dynamic Valuation Model: Automatic recalculations of Net Present Value (NPV) and intrinsic value based on your adjustments.
- Scenario Testing: Develop various forecasting scenarios to evaluate different valuation results.
- User-Friendly Design: Intuitive, organized, and suitable for both professionals and novices.
How It Works
- 1. Access the Template: Download and open the Excel file featuring Southern States Bancshares, Inc.'s (SSBK) preloaded data.
- 2. Adjust Assumptions: Modify key inputs such as growth rates, WACC, and capital expenditures specific to SSBK.
- 3. View Results Instantly: The DCF model automatically calculates the intrinsic value and NPV for SSBK.
- 4. Explore Scenarios: Analyze various forecasts to evaluate different valuation outcomes for SSBK.
- 5. Present with Confidence: Share professional valuation insights to back your decisions regarding SSBK.
Why Choose This Calculator for Southern States Bancshares, Inc. (SSBK)?
- Accurate Data: Up-to-date Southern States financials provide trustworthy valuation outcomes.
- Customizable: Tailor key inputs such as growth rates, WACC, and tax rates to align with your forecasts.
- Time-Saving: Built-in calculations save you the hassle of starting from the ground up.
- Professional-Grade Tool: Crafted for investors, analysts, and financial consultants.
- User-Friendly: Easy-to-navigate design and clear instructions ensure accessibility for all users.
Who Should Use This Product?
- Investors: Evaluate the fair value of Southern States Bancshares, Inc. (SSBK) to inform your investment choices.
- CFOs: Utilize a sophisticated DCF model for accurate financial reporting and analysis.
- Consultants: Easily customize the template for client valuation reports related to SSBK.
- Entrepreneurs: Discover financial modeling techniques employed by leading financial institutions.
- Educators: Implement it as an educational resource to teach valuation methodologies.
What the Template Contains
- Pre-Filled Data: Includes Southern States Bancshares, Inc.'s (SSBK) historical financials and forecasts.
- Discounted Cash Flow Model: Editable DCF valuation model with automatic calculations.
- Weighted Average Cost of Capital (WACC): A dedicated sheet for calculating WACC based on custom inputs.
- Key Financial Ratios: Analyze Southern States Bancshares, Inc.'s (SSBK) profitability, efficiency, and leverage.
- Customizable Inputs: Edit revenue growth, margins, and tax rates with ease.
- Clear Dashboard: Charts and tables summarizing key valuation results.
Disclaimer
All information, articles, and product details provided on this website are for general informational and educational purposes only. We do not claim any ownership over, nor do we intend to infringe upon, any trademarks, copyrights, logos, brand names, or other intellectual property mentioned or depicted on this site. Such intellectual property remains the property of its respective owners, and any references here are made solely for identification or informational purposes, without implying any affiliation, endorsement, or partnership.
We make no representations or warranties, express or implied, regarding the accuracy, completeness, or suitability of any content or products presented. Nothing on this website should be construed as legal, tax, investment, financial, medical, or other professional advice. In addition, no part of this site—including articles or product references—constitutes a solicitation, recommendation, endorsement, advertisement, or offer to buy or sell any securities, franchises, or other financial instruments, particularly in jurisdictions where such activity would be unlawful.
All content is of a general nature and may not address the specific circumstances of any individual or entity. It is not a substitute for professional advice or services. Any actions you take based on the information provided here are strictly at your own risk. You accept full responsibility for any decisions or outcomes arising from your use of this website and agree to release us from any liability in connection with your use of, or reliance upon, the content or products found herein.