
|
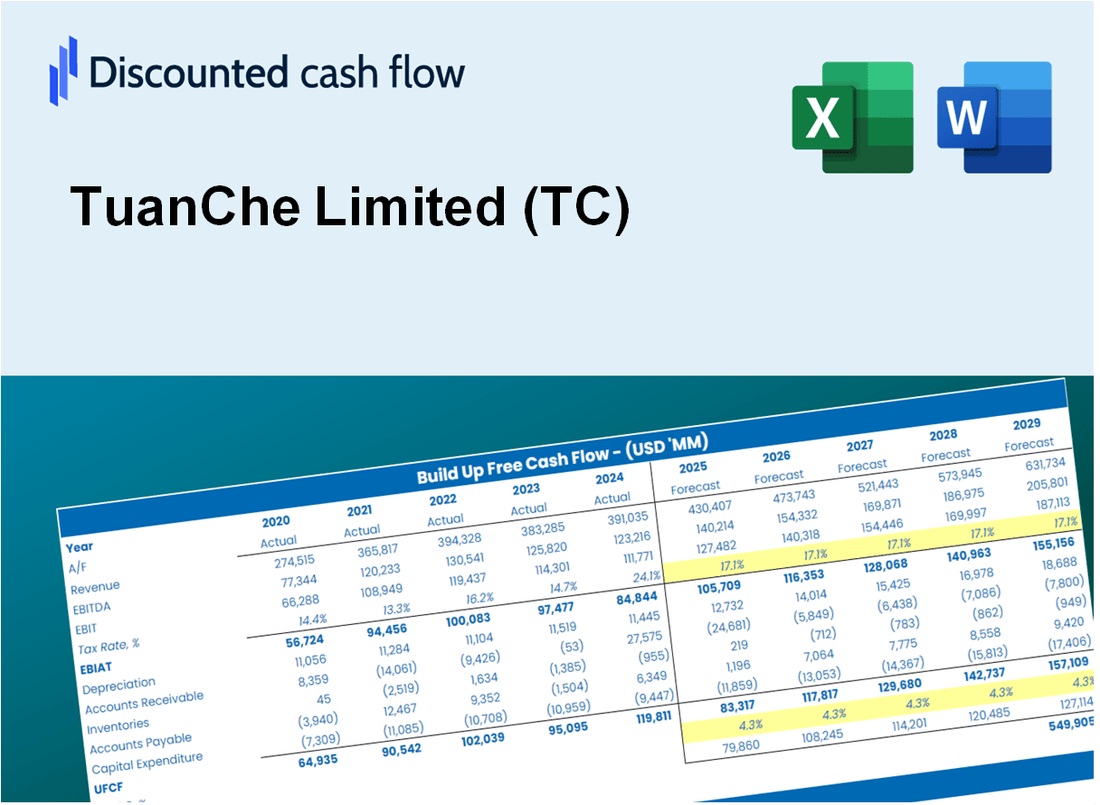
Tuanche Limited (TC) DCF -Bewertung |
Fully Editable: Tailor To Your Needs In Excel Or Sheets
Professional Design: Trusted, Industry-Standard Templates
Investor-Approved Valuation Models
MAC/PC Compatible, Fully Unlocked
No Expertise Is Needed; Easy To Follow
TuanChe Limited (TC) Bundle
Unser DCF -Rechner von Tuanche Limited (TC) für Genauigkeit entwickelt, können Sie die Bewertung der Tuanche Limited (TC) anhand der tatsächlichen Finanzdaten bewerten und die volle Flexibilität bieten, um alle Schlüsselparameter für verbesserte Projektionen zu ändern.
What You Will Receive
- Customizable Excel Template: A fully adjustable Excel-based DCF Calculator featuring pre-filled real TuanChe Limited (TC) financials.
- Accurate Data: Historical figures and forward-looking projections (highlighted in the yellow cells).
- Forecast Adaptability: Modify forecast assumptions such as revenue growth, EBITDA percentage, and WACC.
- Instant Calculations: Quickly observe how your inputs affect TuanChe Limited (TC)’s valuation.
- Professional Resource: Designed for investors, CFOs, consultants, and financial analysts.
- Intuitive Design: Organized for clarity and simplicity, complete with step-by-step guidance.
Key Features
- Comprehensive Historical Data: TuanChe Limited’s (TC) past financial statements and pre-filled projections.
- Customizable Parameters: Modify WACC, tax rates, revenue growth, and EBITDA margins as needed.
- Real-Time Calculations: Monitor TuanChe Limited’s (TC) intrinsic value updates instantly.
- Intuitive Visualizations: Dashboard graphs illustrate valuation outcomes and essential metrics.
- Designed for Precision: A reliable resource for analysts, investors, and finance professionals.
How It Works
- Download: Obtain the pre-built Excel file featuring TuanChe Limited’s (TC) financial data.
- Customize: Modify forecasts such as revenue growth, EBITDA %, and WACC to fit your analysis.
- Update Automatically: Watch as intrinsic value and NPV calculations refresh in real-time.
- Test Scenarios: Generate various projections and instantly compare the results.
- Make Decisions: Leverage the valuation insights to inform your investment approach.
Why Choose This Calculator for TuanChe Limited (TC)?
- All-in-One Solution: Combines DCF, WACC, and financial ratio analyses tailored for TuanChe Limited (TC).
- Flexible Inputs: Modify yellow-highlighted cells to explore different financial scenarios for TuanChe Limited (TC).
- In-Depth Analysis: Automatically computes TuanChe Limited's (TC) intrinsic value and Net Present Value.
- Preloaded Information: Historical and projected data provide reliable foundations for analysis.
- High-Quality Standards: Perfect for financial analysts, investors, and consultants focusing on TuanChe Limited (TC).
Who Should Use TuanChe Limited (TC)?
- Finance Students: Explore innovative automotive retail strategies and apply them using real market data.
- Academics: Integrate industry-specific models into your research or teaching materials.
- Investors: Evaluate your investment hypotheses and assess valuation scenarios for TuanChe Limited (TC).
- Analysts: Enhance your analysis process with a tailored, user-friendly financial model.
- Small Business Owners: Understand how major players in the automotive sector are evaluated and analyzed.
What the Template Contains
- Comprehensive DCF Model: Editable template featuring detailed valuation calculations for TuanChe Limited (TC).
- Real-World Data: TuanChe Limited's historical and projected financials preloaded for in-depth analysis.
- Customizable Parameters: Modify WACC, growth rates, and tax assumptions to explore various scenarios.
- Financial Statements: Complete annual and quarterly breakdowns for enhanced insights into TuanChe Limited (TC).
- Key Ratios: Integrated analysis for profitability, efficiency, and leverage metrics.
- Dashboard with Visual Outputs: Charts and tables designed for clear, actionable results specific to TuanChe Limited (TC).
Disclaimer
All information, articles, and product details provided on this website are for general informational and educational purposes only. We do not claim any ownership over, nor do we intend to infringe upon, any trademarks, copyrights, logos, brand names, or other intellectual property mentioned or depicted on this site. Such intellectual property remains the property of its respective owners, and any references here are made solely for identification or informational purposes, without implying any affiliation, endorsement, or partnership.
We make no representations or warranties, express or implied, regarding the accuracy, completeness, or suitability of any content or products presented. Nothing on this website should be construed as legal, tax, investment, financial, medical, or other professional advice. In addition, no part of this site—including articles or product references—constitutes a solicitation, recommendation, endorsement, advertisement, or offer to buy or sell any securities, franchises, or other financial instruments, particularly in jurisdictions where such activity would be unlawful.
All content is of a general nature and may not address the specific circumstances of any individual or entity. It is not a substitute for professional advice or services. Any actions you take based on the information provided here are strictly at your own risk. You accept full responsibility for any decisions or outcomes arising from your use of this website and agree to release us from any liability in connection with your use of, or reliance upon, the content or products found herein.