
|
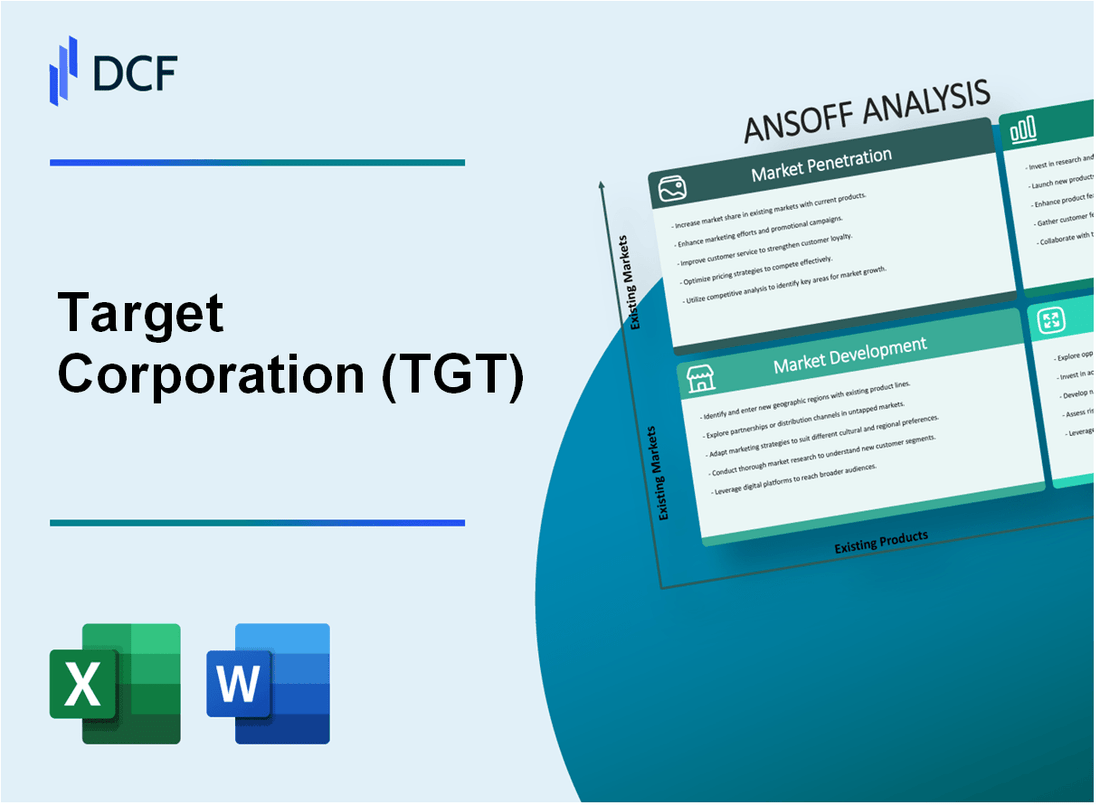
Target Corporation (TGT): ANSOFF-Matrixanalyse |
Fully Editable: Tailor To Your Needs In Excel Or Sheets
Professional Design: Trusted, Industry-Standard Templates
Investor-Approved Valuation Models
MAC/PC Compatible, Fully Unlocked
No Expertise Is Needed; Easy To Follow
Target Corporation (TGT) Bundle
Target Corporation befindet sich in einem entscheidenden Moment der strategischen Transformation und nutzt die leistungsstarke Ansoff-Matrix als Blaupause für beispielloses Wachstum und Innovation. Durch die sorgfältige Ausarbeitung von Strategien in den Bereichen Marktdurchdringung, Marktentwicklung, Produktentwicklung und Diversifizierung positioniert sich Target nicht nur, um im Wettbewerb zu bestehen, sondern auch, um Einzelhandelsexzellenz in einem zunehmend digitalen und dynamischen Markt neu zu definieren. Dieser umfassende Ansatz verspricht, neue Einnahmequellen zu erschließen, neue Verbrauchersegmente anzusprechen und modernste Technologien zu nutzen, die möglicherweise die Einzelhandelslandschaft neu gestalten könnten.
Target Corporation (TGT) – Ansoff-Matrix: Marktdurchdringung
Erweitern Sie Ihre digitalen Marketingbemühungen
Der digitale Umsatz von Target erreichte im Jahr 2022 23,2 Milliarden US-Dollar, was 18,7 % des Gesamtumsatzes entspricht. Der Online-Umsatz stieg im Vergleich zum Vorjahr um 2,6 %. Die Downloads mobiler Apps stiegen im Jahr 2022 um 35 %.
| Digitale Verkaufsmetrik | Leistung 2022 |
|---|---|
| Gesamter digitaler Umsatz | 23,2 Milliarden US-Dollar |
| Digitales Umsatzwachstum | 2.6% |
| Mobile App-Downloads | Steigerung um 35 % |
Verbessern Sie das Treueprogramm
Das Treueprogramm Target Circle hat im Jahr 2022 145 Millionen Mitglieder. Programmmitglieder erwirtschaften 40 % des gesamten Unternehmensumsatzes. Die durchschnittlichen Ausgaben pro Treuemitglied betragen 1.200 US-Dollar pro Jahr.
- Gesamtzahl der Mitglieder des Treueprogramms: 145 Millionen
- Umsatzbeteiligung von Treuemitgliedern: 40 %
- Durchschnittliche jährliche Ausgaben der Mitglieder: 1.200 $
Optimieren Sie Preisstrategien
Die Preisanpassungsrichtlinie von Target gilt für 29 große Einzelhändler. Preissensible Verbraucher machen 52 % des Kundenstamms von Target aus. Der durchschnittliche Preisnachlass über alle Produktkategorien hinweg beträgt 7,3 %.
| Preisstrategiemetrik | Wert |
|---|---|
| Preisanpassung für Einzelhändler | 29 |
| Preissensible Verbraucher | 52% |
| Durchschnittliche Preissenkung | 7.3% |
Verbessern Sie das Erlebnis im Laden
Target betreibt 1.948 Geschäfte in den Vereinigten Staaten. Die durchschnittlichen Ladenumbaukosten betragen 5,2 Millionen US-Dollar. Der Kundenzufriedenheitswert verbesserte sich im Jahr 2022 auf 78 %.
Steigern Sie Cross-Selling und Upselling
Cross-Selling-Initiativen generierten zusätzliche Einnahmen in Höhe von 4,6 Milliarden US-Dollar. Der durchschnittliche Transaktionswert stieg durch Upselling-Strategien um 12,4 %. Die Cross-Selling-Rate der Produktkategorien beträgt 22 %.
| Cross-Selling-Metrik | Leistung 2022 |
|---|---|
| Zusätzliche Einnahmen | 4,6 Milliarden US-Dollar |
| Steigerung des Transaktionswerts | 12.4% |
| Cross-Selling-Rate der Produktkategorie | 22% |
Target Corporation (TGT) – Ansoff-Matrix: Marktentwicklung
Expandieren Sie in unterversorgte geografische Regionen innerhalb der Vereinigten Staaten
Target identifizierte im Jahr 2022 116 neue Filialstandorte in unterversorgten Märkten und konzentrierte sich dabei auf strategische Ballungsräume mit potenziellen Wachstumschancen.
| Region | Neue Geschäfte | Marktdurchdringung |
|---|---|---|
| Mittlerer Westen | 42 | 27% |
| Südwesten | 38 | 22% |
| Südosten | 36 | 19% |
Entwickeln Sie kleinere Geschäfte für städtische und vorstädtische Märkte
Target eröffnete im Jahr 2022 29 kleinere Geschäfte mit einer durchschnittlichen Fläche von 40.000 Quadratmetern im Vergleich zu herkömmlichen 135.000 Quadratmetern.
- Grundfläche des städtischen Ladens: 30.000–50.000 Quadratfuß
- Vorstadt-Kompaktladen: 40.000–60.000 m²
- Durchschnittliche Investition pro kleinformatigem Geschäft: 5,2 Millionen US-Dollar
Zielen Sie auf aufstrebende demografische Segmente ab
Millennials und Gen Z machen im Jahr 2022 68 % der Neukundengewinnungsstrategie von Target aus.
| Demographisch | Kundenbindung | Digitale Interaktion |
|---|---|---|
| Millennials | 42% | 65 % Online-Käufe |
| Gen Z | 26% | 78 % digitale Interaktion |
Entdecken Sie mögliche internationale Expansion
Target ist derzeit ausschließlich in den Vereinigten Staaten tätig und hat ab 2022 keine aktiven internationalen Expansionspläne.
Stärken Sie die Präsenz auf dem Online-Marktplatz
Der E-Commerce-Umsatz von Target erreichte im Jahr 2022 25,3 Milliarden US-Dollar, was 17,2 % des gesamten Einzelhandelsumsatzes entspricht.
- Online-Umsatzwachstum: 13,4 % im Jahresvergleich
- Investitionen in digitale Plattformen: 412 Millionen US-Dollar
- Nutzer mobiler Apps: 35 Millionen aktive Nutzer pro Monat
Target Corporation (TGT) – Ansoff-Matrix: Produktentwicklung
Führen Sie mehr Eigenmarken- und Exklusivmarkenangebote ein
Target meldete im Jahr 2022 Eigenmarkenumsätze in Höhe von 30,5 Milliarden US-Dollar, was 34 % des Gesamtumsatzes entspricht. Das Unternehmen verfügt über 10 eigene Marken, die einen Jahresumsatz von über 1 Milliarde US-Dollar erwirtschaften, darunter Good & Sammeln Sie, Katze & Jack und Up & Auf.
| Eigene Marke | Jährlicher Verkauf | Produktkategorie |
|---|---|---|
| Gut & Sammeln | 2,5 Milliarden US-Dollar | Essen & Lebensmittelgeschäft |
| Katze & Jack | 2,2 Milliarden US-Dollar | Kinderbekleidung |
| Auf & Auf | 1,8 Milliarden US-Dollar | Persönliche Betreuung |
Entwickeln Sie nachhaltige und umweltfreundliche Produktlinien
Target hat bis 2025 2 Milliarden US-Dollar für die nachhaltige Produktentwicklung bereitgestellt. Im Jahr 2022 wurden 60 % der Produkte seiner eigenen Marke unter Berücksichtigung der Nachhaltigkeit entwickelt.
- 100 % recycelte Kunststoffverpackung für Up & Up-Marke
- Reduzierter Einsatz von Neukunststoff in den Produktlinien um 15 %
- 50 Millionen US-Dollar in zirkuläre Designinitiativen investiert
Erweitern Sie die Produktkategorien Körperpflege und Wellness
Das Segment Körperpflege und Wellness wuchs im Jahr 2022 um 22 % und erreichte einen Jahresumsatz von 4,3 Milliarden US-Dollar. Target hat im vergangenen Jahr 150 neue Wellness-Produkt-SKUs auf den Markt gebracht.
| Wellness-Kategorie | Wachstumsrate | Produkterweiterung |
|---|---|---|
| Natürliche Nahrungsergänzungsmittel | 28% | 45 neue SKUs |
| Bio-Hautpflege | 19% | 35 neue SKUs |
| Fitnesszubehör | 16% | 70 neue SKUs |
Erstellen Sie technologieintegrierte Produktreihen für Wohnen und Lifestyle
Der Umsatz mit Smart-Home-Produkten stieg im Jahr 2022 um 35 % und erreichte 750 Millionen US-Dollar. Target hat mit 12 Technologiemarken zusammengearbeitet, um integrierte Produktlinien zu entwickeln.
- 100 Millionen US-Dollar in die Forschung und Entwicklung von Smart-Home-Technologie investiert
- Einführung von 85 neuen Smart-Home-Produkt-SKUs
- Erweiterte Partnerschaften mit Apple, Google und Amazon
Entwickeln Sie innovative digitale und Smart-Home-Produktkollektionen
Digitale Produktkollektionen erwirtschafteten einen Umsatz von 1,2 Milliarden US-Dollar, was einem Wachstum von 18 % gegenüber dem Vorjahr entspricht. Target hat 60 neue Digital-First-Produktlinien entwickelt.
| Kategorie „Digitale Produkte“. | Einnahmen | Wachstumsrate |
|---|---|---|
| Smart-Home-Geräte | 450 Millionen Dollar | 22% |
| Digitales Zubehör | 350 Millionen Dollar | 15% |
| Vernetzte Lifestyle-Produkte | 400 Millionen Dollar | 25% |
Target Corporation (TGT) – Ansoff-Matrix: Diversifikation
Investieren Sie in digitale Technologie und E-Commerce-Infrastruktur
Target investierte im Jahr 2022 4,1 Milliarden US-Dollar in digitale Technologie. Der digitale Umsatz stieg im vierten Quartal 2022 um 9 %, was 20,6 % des Gesamtumsatzes entspricht. Das Unternehmen führte über Shipt einen Lieferservice am selben Tag ein, der im Jahr 2022 12,5 Millionen Bestellungen abwickelte.
| Kategorie „Digitale Investitionen“. | Investierter Betrag ($) |
|---|---|
| E-Commerce-Plattform | 1,2 Milliarden |
| Mobile Technologie | 750 Millionen |
| Cloud-Infrastruktur | 600 Millionen |
Entdecken Sie strategische Partnerschaften mit Technologie- und Gesundheitsunternehmen
Ziel ist es, etablierte Partnerschaften mit CVS Health einzugehen, das 80 In-Store-Kliniken betreibt. Arbeitete mit Apple zusammen und generierte im Jahr 2022 einen Umsatz mit technischen Produkten in Höhe von 1,5 Milliarden US-Dollar.
- Einnahmen aus der CVS Health-Partnerschaft: 350 Millionen US-Dollar
- Umsatz durch Technologiepartnerschaften: 1,5 Milliarden US-Dollar
- Erweiterung des Gesundheitsdienstes: 80 Kliniken in den Filialen
Entwickeln Sie abonnementbasierte Dienste für bestimmte Produktkategorien
Target führte Abonnementdienste in mehreren Kategorien ein und generierte im Jahr 2022 wiederkehrende Einnahmen in Höhe von 275 Millionen US-Dollar.
| Abonnementkategorie | Monatliche Abonnenten | Jahresumsatz ($) |
|---|---|---|
| Baby-Essentials | 125,000 | 87 Millionen |
| Heimtierbedarf | 95,000 | 68 Millionen |
| Haushaltswaren | 75,000 | 55 Millionen |
Erstellen Sie Finanzdienstleistungen oder Fintech-Angebote
Das Target RedCard-Programm erzielte im Jahr 2022 einen Umsatz von 6,2 Milliarden US-Dollar mit 28 Millionen aktiven Karteninhabern.
- Gesamter RedCard-Umsatz: 6,2 Milliarden US-Dollar
- Aktive Karteninhaber: 28 Millionen
- Durchschnittlicher Transaktionswert: 221 $
Investieren Sie in Datenanalyse- und Personalisierungstechnologien
Target stellte im Jahr 2022 950 Millionen US-Dollar für Datenanalyse- und Personalisierungstechnologien bereit, was zu einer Steigerung der gezielten Marketingeffizienz um 12 % führte.
| Technologieinvestitionen | Betrag ($) | Leistungsverbesserung |
|---|---|---|
| Maschinelles Lernen | 350 Millionen | 15 % Empfehlungsgenauigkeit |
| Kundendatenplattform | 275 Millionen | 12 % Marketingeffizienz |
| Prädiktive Analytik | 325 Millionen | 10 % Umsatzumwandlung |
Target Corporation (TGT) - Ansoff Matrix: Market Penetration
You're looking at how Target Corporation is digging deeper into its existing customer base and current markets, which is the Market Penetration quadrant of the Ansoff Matrix. This is about maximizing sales from the people who already know and shop at Target.
The focus is definitely on accelerating those same-day services. Drive Up, along with its siblings, was the fastest-growing mode of shopping in 2024. For the first quarter of fiscal 2025, same-day delivery powered by Target Circle 360 saw growth of more than 35%. Even in the third quarter of fiscal 2025, same-day services jumped more than 35%. The plan is to keep pushing that growth in 2025 and beyond by making the Drive Up and Returns experiences even slicker.
To enhance the in-store experience for core customers, Target is putting serious capital to work. The company unveiled a transformative investment plan for 2025, targeting approximately $5 billion in total capital expenditures. This represents a roughly $1 billion increase year-on-year from the prior year's investment of $4 billion. About 75% of U.S. consumers already live within a 10-mile radius of a Target store, so remodeling existing locations is key to elevating that local experience.
Here's a quick look at the physical footprint expansion supporting this strategy:
| Metric | 2024 Actual/Plan | 2025 Plan |
|---|---|---|
| New Stores Opened | 23 | Approximately 20 |
| Total New Stores Over 10 Years | N/A | More than 300 |
| Total U.S. Stores (Approx.) | Nearly 2,000 | N/A |
| Large Format Store Size Benchmark | Chain average: 125,000 square feet | Majority of new stores are large format |
The digital side is getting a major boost from AI. Machine-learning forecasting has already delivered a 150+ basis point improvement in in-stock rates for the top 5,000 most-purchased items. Digital comparable sales were up 2.4% in the third quarter of fiscal 2025. You'll see this manifest in tools like the Gen-AI Gift Finder and an upgraded 'Store Mode' app feature that acts as a personal shopping assistant.
Maintaining competitive pricing is a continuation of a major effort. Target announced plans to lower everyday regular prices on approximately 5,000 frequently shopped items. As of May 2024, they had already cut prices on about 1,500 products. This pricing strategy is layered on top of the Target Circle Card benefit, where members save an extra 5%. This focus on value comes as the company projects full-year 2025 Net Sales growth around 1%, with comparable sales growth expected to be around flat. For context, full-year 2024 Net Sales were $106.6 billion.
The Market Penetration efforts are supported by these key digital and value drivers:
- Digital comparable sales rose 2.4% in Q3 fiscal 2025.
- Same-day services growth exceeded 35% in Q1 2025.
- Price cuts target 5,000 frequently shopped items.
- Target Circle Card members receive an extra 5% savings.
- Capital investment for 2025 is set at $5 billion.
Finance: draft 13-week cash view by Friday.
Target Corporation (TGT) - Ansoff Matrix: Market Development
You're looking at how Target Corporation expands its reach into new customer groups and geographies, which is the Market Development quadrant of the Ansoff Matrix. This is about taking what Target does well and planting it in fresh soil, both physically and digitally.
The digital marketplace is a key area for this expansion. Target plans to dramatically grow its Target Plus third-party digital sales from approximately $1 billion in 2024 to more than $5 billion by 2030. This growth involves adding hundreds of new brands, such as Peloton, Daily Harvest, and Honest Baby Clothing, to attract new guests and broaden the digital assortment.
For physical expansion into dense urban areas, Target has historically experimented with smaller-format stores. These small versions can be as little as 13,000 square feet, though they average about 40,000 square feet, significantly smaller than the typical 130,000-square-foot full-size Target. While Target had been opening 30 to 40 small-format stores annually around 2021, recent strategy has shifted; for example, Target closed four small-format stores in 2023 in markets like Washington, D.C., and Minneapolis. Still, 38% of Target customers are homeowners living in urban areas, showing the segment's importance.
To capture the city-dweller segment and others not currently served, Target is focusing on its loyalty program enhancements. The paid Target Circle 360 membership, which costs $99 per year or $10.99 per month, is a major lever. Target aims to triple its Target Circle 360 membership base over the next three years. The value proposition is clear: Target Circle members spent three times more on average than non-members in 2024, and Target Circle 360 members spent an average of eight times more. Same-day delivery powered by Target Circle 360 saw year-over-year growth of more than 25% in the second quarter of 2025.
Regarding the broader U.S. consumer base, Target has established significant physical proximity, as +75% of the U.S. population lives within 10 miles of a store. This means digital marketing efforts are aimed at the remaining segment-the less than 25% of U.S. consumers who live outside that 10-mile radius-to drive online sales and engagement. Digital sales showed resilience, growing by 4.3% in the second quarter of 2025.
For the digital-only international shipping pilot of owned brands like Cat & Jack, the specific financial or operational metrics for this initiative are not publicly detailed at this time, but it aligns with the overall digital growth strategy.
Here's a quick look at the financial context surrounding these market development efforts, based on recent fiscal performance:
| Metric | Value/Amount | Period/Context |
| FY 2024 Net Sales | $106.6 billion | Fiscal year ended February 3, 2025 |
| FY 2024 Net Sales Change | -0.8% | Compared to the previous year |
| FY 2024 Comparable Sales Change | +0.1% | Driven by digital sales growth |
| Q2 2025 Digital Sales Growth | +4.3% | Second quarter of fiscal 2025 |
| Total U.S. Stores Operated | 1,978 | As of February 2025 |
| Target Plus GMV (2024) | $1 billion | Gross Merchandise Volume |
The strategy is definitely about expanding the customer base, both geographically and digitally. Finance: draft the Q3 2025 cash flow projection update by Tuesday.
Target Corporation (TGT) - Ansoff Matrix: Product Development
You're looking at how Target Corporation is pushing new products into its existing market, which is the Product Development quadrant of the Ansoff Matrix. This is all about expanding the offering for the current customer base.
Target is definitely leaning hard into its private label strength to drive frequency and delight. For the Good & Gather brand, and its sister brand Favorite Day, the plan for 2025 includes adding 600 new items to the grocery assortment alone. This push includes the new Good & Gather Collabs, which feature items co-created with chefs; the first round of these items, like frozen pizzas from Chef Ann Kim, starts at just under $7. The Good & Gather brand itself is nearing a significant milestone, close to becoming Target Corporation's first store brand to hit $4 billion in annual sales, and it currently offers over 2,500 items.
The overall owned brand portfolio, which includes staples like Cat & Jack and up&up, is a massive engine for the business, having generated over $30 billion in sales back in 2023. Introducing new owned brands in high-growth areas is a core part of the strategy to build on that base.
The company is also executing a multi-year initiative starting in 2025 to reimagine key discretionary categories. This refresh is hitting areas like gaming, sports, and toys with expanded assortments. We see early success in this area, as trading cards are tracking to become a more-than-$1 billion business for Target Corporation in 2025.
In the beauty category, the expansion is substantial. Target introduced more than 2,000 new items across nearly 45 new brands. The focus here is clear on value, with 90% of these new arrivals priced under $20, and some items starting as low as $1.29.
Here's a snapshot of the product development focus areas and associated numbers:
| Category Focus Area | 2025/Recent Metric | Associated Value/Amount |
| Good & Gather/Favorite Day New Items | Planned additions for 2025 | 600 items |
| Good & Gather Collabs Starting Price | Price point for initial chef-created items | Under $7 |
| Beauty New Items | Total new items introduced | More than 2,000 |
| Beauty New Brands | Total new brands introduced | More than 45 |
| Beauty New Items Price Point | Percentage priced under a threshold | 90% under $20 |
| Owned Brand Portfolio Sales Base | Sales generated (2023 data as proxy for current scale) | Over $30 billion |
| Trading Cards Business | Tracking to reach this level in 2025 | More-than-$1 billion |
Target Corporation is also continuing to develop curated, new product experiences through shop-in-shops. You'll see more of these with partners like Warby Parker and Champion, building on existing successful concepts like the Ulta Beauty presence.
The execution of these product introductions is supported by a focus on speed in other areas, like apparel, where the goal is reducing the time to design, source, and get product on shelves. This responsiveness is key to ensuring the new products hit the market at the right time. The company is investing $4 billion to $5 billion in stores, supply chain, and technology in 2025 to support these merchandising revamps.
You can see the planned product development initiatives for the year:
- Launch Good & Gather Collabs with chefs, adding 600 new items to the grocery private label in 2025.
- Refresh key discretionary categories like gaming, sports, and toys with expanded assortments starting in 2025.
- Expand the beauty category by introducing more than 45 new brands and 2,000 new items, mostly under $20.
- Introduce new owned brands in high-growth areas, building on the portfolio that generated over $30 billion in annual sales in 2023.
- Develop more shop-in-shops with partners like Warby Parker and Champion to offer curated, new product experiences.
Finance: draft the projected impact on private label gross margin for the next two quarters based on the new low-priced beauty assortment.
Target Corporation (TGT) - Ansoff Matrix: Diversification
You're looking at how Target Corporation (TGT) moves beyond its core retail business, which is the essence of diversification in the Ansoff Matrix. This isn't about selling more of the same stuff; it's about building entirely new revenue engines using the massive customer base and data assets already in place. Honestly, the numbers here show a clear intent to monetize the ecosystem.
Double the size of the Roundel media business, which drove nearly $2 billion in value last year, targeting new B2B advertising clients. Roundel's advertising revenue hit $649 million in 2024. Executives believe this business, which connects brands to more than 165 million omnichannel guests, can double its value by 2030. For a concrete look at recent momentum, Q1 2025 ad revenue for Roundel was $163 million, up from $130 million in Q1 2024. Target Product Ads (TPAs) specifically saw more than 35% sales growth in 2024.
Develop a new financial services product line, leveraging the Target Circle data for personalized credit or payment solutions. The loyalty program is a powerhouse: active Target Circle members spend three times more on average than nonmembers. For the paid tier, Target Circle 360 subscribers spend an average of eight times more. The company added 13 million members to its loyalty programs in 2024. As of February 1, 2025, deferred revenue related to the Target Circle program stood at $19 million. The goal is to triple Target Circle 360 membership over the next three years.
Acquire a specialized, non-retail logistics or fulfillment technology company to offer third-party supply chain services. Target has a history here, having acquired Shipt for $550 million in 2017 and Grand Junction in 2017. The current investment focus is scaling this infrastructure; Target plans to invest more than $4 billion this year (2025) in operations. The retailer is expanding its U.S. sortation network with a goal to reach 15 sortation centers by the end of 2026.
Launch a subscription box service for a niche category (e.g., premium home goods) to a new, higher-income customer base. While a specific subscription box launch isn't detailed, the growth of the third-party marketplace, Target Plus, shows a path for new offerings. Target aims to grow Target Plus digital sales from approximately $1 billion in 2024 to more than $5 billion by 2030. This marketplace growth is intended to attract hundreds of new brands.
Form a strategic partnership with Marriott Bonvoy to offer new travel rewards, entering the travel loyalty market. This partnership is specifically planned as a new perk for Target Circle 360 members. To give you context on the scale of the related loyalty program, Target reported net sales of $23.8 billion in Q1 2025.
Here's a quick look at the scale of these non-retail ventures:
| Diversification Area | Key Metric | Value/Target |
| Roundel Media | Value Generated Last Year | Nearly $2 billion |
| Roundel Media | 2024 Advertising Revenue | $649 million |
| Target Circle (Financial Data) | Active Member Spend Multiplier | 3 times nonmembers |
| Target Circle 360 | Subscriber Spend Multiplier | 8 times nonmembers |
| Target Plus Marketplace | 2024 Sales (Proxy for new service scale) | Approximately $1 billion |
| Supply Chain Tech | Sortation Centers Goal by 2026 | 15 facilities |
The data shows Target is using its existing customer base to fuel growth in media and loyalty, while making significant capital investments in logistics infrastructure. Finance: draft 13-week cash view by Friday.
Disclaimer
All information, articles, and product details provided on this website are for general informational and educational purposes only. We do not claim any ownership over, nor do we intend to infringe upon, any trademarks, copyrights, logos, brand names, or other intellectual property mentioned or depicted on this site. Such intellectual property remains the property of its respective owners, and any references here are made solely for identification or informational purposes, without implying any affiliation, endorsement, or partnership.
We make no representations or warranties, express or implied, regarding the accuracy, completeness, or suitability of any content or products presented. Nothing on this website should be construed as legal, tax, investment, financial, medical, or other professional advice. In addition, no part of this site—including articles or product references—constitutes a solicitation, recommendation, endorsement, advertisement, or offer to buy or sell any securities, franchises, or other financial instruments, particularly in jurisdictions where such activity would be unlawful.
All content is of a general nature and may not address the specific circumstances of any individual or entity. It is not a substitute for professional advice or services. Any actions you take based on the information provided here are strictly at your own risk. You accept full responsibility for any decisions or outcomes arising from your use of this website and agree to release us from any liability in connection with your use of, or reliance upon, the content or products found herein.