
|
TC Energy Corporation (TRP) DCF -Bewertung |
Fully Editable: Tailor To Your Needs In Excel Or Sheets
Professional Design: Trusted, Industry-Standard Templates
Investor-Approved Valuation Models
MAC/PC Compatible, Fully Unlocked
No Expertise Is Needed; Easy To Follow
TC Energy Corporation (TRP) Bundle
Verbessern Sie Ihre Anlagestrategien mit dem DCF -Taschenrechner der TC Energy Corporation (TRP)! Verwenden Sie reale Finanzdaten aus TC -Energie, passen Sie Wachstumsprojektionen und Kosten an und beobachten Sie sofort, wie sich diese Anpassungen auf den inneren Wert der TC Energy Corporation (TRP) auswirken.
What You Will Receive
- Comprehensive Financial Model: TC Energy Corporation’s (TRP) real data provides an accurate DCF valuation.
- Complete Forecast Control: Modify revenue growth, profit margins, WACC, and other essential parameters.
- Real-Time Calculations: Automatic updates allow you to view results instantly as you make adjustments.
- Professional-Grade Template: A polished Excel file crafted for high-quality valuation purposes.
- Flexible and Reusable: Designed for adaptability, enabling repeated use for thorough forecasts.
Key Features
- Comprehensive Data: TC Energy Corporation’s (TRP) historical financial statements and pre-filled projections.
- Customizable Inputs: Modify WACC, tax rates, revenue growth, and EBITDA margins as needed.
- Real-Time Results: View TC Energy Corporation’s (TRP) intrinsic value updating instantly.
- Visual Performance Metrics: Dashboard graphs illustrate valuation outcomes and important indicators.
- Engineered for Precision: A reliable tool designed for analysts, investors, and finance professionals.
How It Works
- Step 1: Download the Excel file for TC Energy Corporation (TRP).
- Step 2: Examine the pre-filled financial data and projections for TC Energy Corporation (TRP).
- Step 3: Adjust key inputs such as revenue growth, WACC, and tax rates (highlighted cells).
- Step 4: Observe the DCF model refresh in real-time as you modify your assumptions.
- Step 5: Evaluate the results and leverage the insights for your investment strategies.
Why Choose This Calculator for TC Energy Corporation (TRP)?
- User-Friendly Interface: Perfectly crafted for both novices and seasoned professionals.
- Customizable Inputs: Easily adjust parameters to suit your financial analysis.
- Real-Time Feedback: Observe immediate updates to TC Energy’s valuation as you modify inputs.
- Pre-Configured Data: Comes with TC Energy’s latest financial statistics for swift evaluations.
- Relied Upon by Experts: Favored by investors and analysts for making well-informed choices.
Who Should Use This Product?
- Investors: Evaluate TC Energy Corporation's (TRP) valuation before making investment decisions.
- CFOs and Financial Analysts: Optimize valuation methodologies and assess financial forecasts.
- Startup Founders: Understand how established firms like TC Energy Corporation are appraised.
- Consultants: Provide comprehensive valuation analyses for diverse clientele.
- Students and Educators: Utilize current data to learn and teach valuation practices effectively.
What the Template Contains
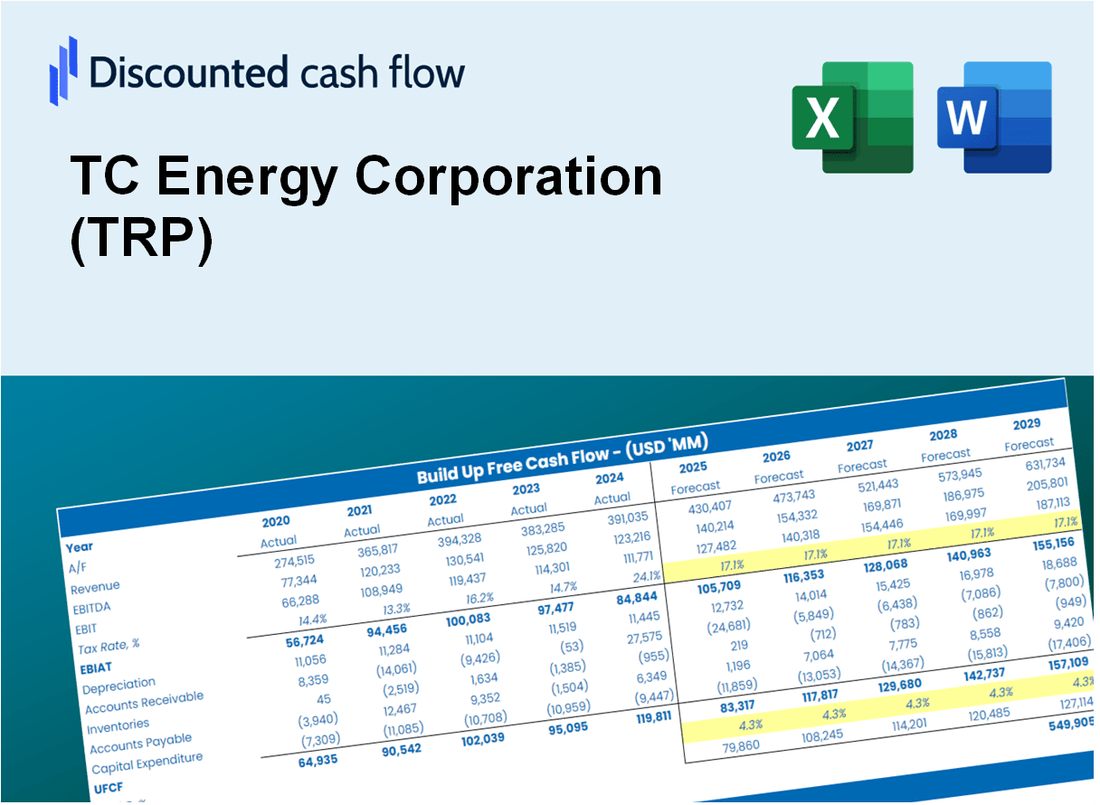
- Operating and Balance Sheet Data: Pre-filled TC Energy Corporation (TRP) historical data and forecasts, including revenue, EBITDA, EBIT, and capital expenditures.
- WACC Calculation: A dedicated sheet for Weighted Average Cost of Capital (WACC), including parameters like Beta, risk-free rate, and share price.
- DCF Valuation (Unlevered and Levered): Editable Discounted Cash Flow models showing intrinsic value with detailed calculations.
- Financial Statements: Pre-loaded financial statements (annual and quarterly) to support analysis.
- Key Ratios: Includes profitability, leverage, and efficiency ratios for TC Energy Corporation (TRP).
- Dashboard and Charts: Visual summary of valuation outputs and assumptions to analyze results easily.
Disclaimer
All information, articles, and product details provided on this website are for general informational and educational purposes only. We do not claim any ownership over, nor do we intend to infringe upon, any trademarks, copyrights, logos, brand names, or other intellectual property mentioned or depicted on this site. Such intellectual property remains the property of its respective owners, and any references here are made solely for identification or informational purposes, without implying any affiliation, endorsement, or partnership.
We make no representations or warranties, express or implied, regarding the accuracy, completeness, or suitability of any content or products presented. Nothing on this website should be construed as legal, tax, investment, financial, medical, or other professional advice. In addition, no part of this site—including articles or product references—constitutes a solicitation, recommendation, endorsement, advertisement, or offer to buy or sell any securities, franchises, or other financial instruments, particularly in jurisdictions where such activity would be unlawful.
All content is of a general nature and may not address the specific circumstances of any individual or entity. It is not a substitute for professional advice or services. Any actions you take based on the information provided here are strictly at your own risk. You accept full responsibility for any decisions or outcomes arising from your use of this website and agree to release us from any liability in connection with your use of, or reliance upon, the content or products found herein.