
|
William Penn Bancorporation (WMPN) DCF -Bewertung |
Fully Editable: Tailor To Your Needs In Excel Or Sheets
Professional Design: Trusted, Industry-Standard Templates
Investor-Approved Valuation Models
MAC/PC Compatible, Fully Unlocked
No Expertise Is Needed; Easy To Follow
William Penn Bancorporation (WMPN) Bundle
Entdecken Sie den wahren Wert von William Penn Bancorporation (WMPN) mit unserem erweiterten DCF -Taschenrechner! Passen Sie die wichtigsten Annahmen an, erkunden Sie verschiedene Szenarien und beurteilen Sie, wie Änderungen die Bewertung von William Penn Bancorporation (WMPN) beeinflussen - alles innerhalb einer umfassenden Excel -Vorlage.
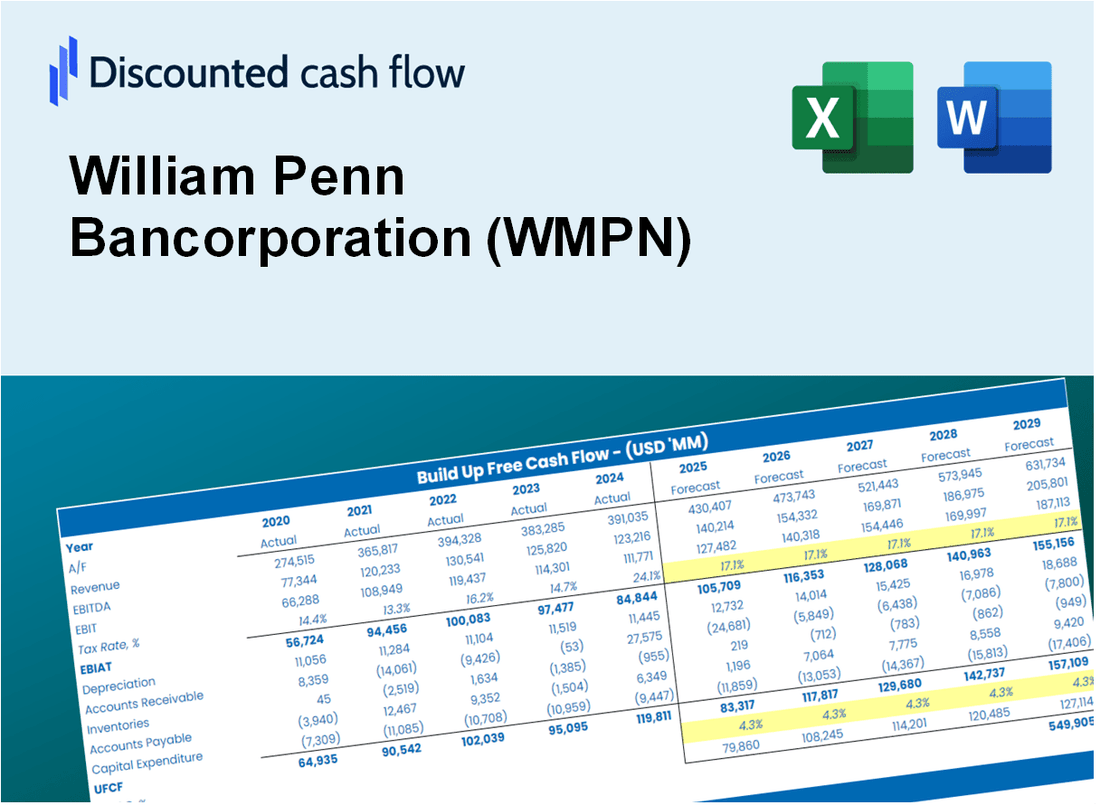
Discounted Cash Flow (DCF) - (USD MM)
| Year | AY1 2020 |
AY2 2021 |
AY3 2022 |
AY4 2023 |
AY5 2024 |
FY1 2025 |
FY2 2026 |
FY3 2027 |
FY4 2028 |
FY5 2029 |
|---|---|---|---|---|---|---|---|---|---|---|
| Revenue | 16.2 | 23.4 | 25.1 | 24.6 | 20.6 | 22.3 | 24.1 | 26.1 | 28.3 | 30.6 |
| Revenue Growth, % | 0 | 44.06 | 7.32 | -1.77 | -16.49 | 8.28 | 8.28 | 8.28 | 8.28 | 8.28 |
| EBITDA | 1.8 | 6.0 | 6.0 | 4.2 | .0 | 3.5 | 3.7 | 4.0 | 4.4 | 4.7 |
| EBITDA, % | 10.89 | 25.54 | 23.96 | 17.15 | 0 | 15.51 | 15.51 | 15.51 | 15.51 | 15.51 |
| Depreciation | .8 | 1.2 | 1.2 | 1.2 | .9 | 1.1 | 1.2 | 1.3 | 1.4 | 1.5 |
| Depreciation, % | 5.08 | 5.31 | 4.79 | 4.95 | 4.55 | 4.94 | 4.94 | 4.94 | 4.94 | 4.94 |
| EBIT | .9 | 4.7 | 4.8 | 3.0 | -.9 | 2.4 | 2.5 | 2.8 | 3.0 | 3.2 |
| EBIT, % | 5.8 | 20.23 | 19.17 | 12.19 | -4.55 | 10.57 | 10.57 | 10.57 | 10.57 | 10.57 |
| Total Cash | 170.4 | 293.9 | 219.5 | 184.9 | 157.3 | 22.3 | 24.1 | 26.1 | 28.3 | 30.6 |
| Total Cash, percent | .0 | .0 | .0 | .0 | .0 | .0 | .0 | .0 | .0 | .0 |
| Account Receivables | 6.1 | 6.3 | 6.0 | 6.2 | .0 | 5.1 | 5.5 | 5.9 | 6.4 | 7.0 |
| Account Receivables, % | 37.48 | 27.03 | 23.89 | 25.17 | 0 | 22.71 | 22.71 | 22.71 | 22.71 | 22.71 |
| Inventories | -85.2 | -170.6 | -6.8 | -21.4 | .0 | -14.0 | -15.1 | -16.4 | -17.8 | -19.2 |
| Inventories, % | -525.6 | -730.31 | -27.3 | -86.88 | 0 | -62.84 | -62.84 | -62.84 | -62.84 | -62.84 |
| Accounts Payable | 10.8 | 5.3 | 5.7 | 5.2 | .0 | 5.9 | 6.4 | 7.0 | 7.6 | 8.2 |
| Accounts Payable, % | 66.68 | 22.87 | 22.76 | 21.28 | 0 | 26.72 | 26.72 | 26.72 | 26.72 | 26.72 |
| Capital Expenditure | -1.8 | -.9 | -.9 | -.3 | -.1 | -.9 | -1.0 | -1.1 | -1.2 | -1.3 |
| Capital Expenditure, % | -11.19 | -3.81 | -3.41 | -1.4 | -0.6857 | -4.1 | -4.1 | -4.1 | -4.1 | -4.1 |
| Tax Rate, % | 157.93 | 157.93 | 157.93 | 157.93 | 157.93 | 157.93 | 157.93 | 157.93 | 157.93 | 157.93 |
| EBITAT | 1.3 | 3.8 | 4.2 | 2.8 | .5 | 1.7 | 1.8 | 2.0 | 2.2 | 2.3 |
| Depreciation | ||||||||||
| Changes in Account Receivables | ||||||||||
| Changes in Inventories | ||||||||||
| Changes in Accounts Payable | ||||||||||
| Capital Expenditure | ||||||||||
| UFCF | 90.3 | 83.8 | -158.5 | 17.6 | -19.1 | 16.8 | 3.3 | 3.5 | 3.8 | 4.2 |
| WACC, % | 12.57 | 10.69 | 11.46 | 11.95 | 3.16 | 9.97 | 9.97 | 9.97 | 9.97 | 9.97 |
| PV UFCF | ||||||||||
| SUM PV UFCF | 25.8 | |||||||||
| Long Term Growth Rate, % | 2.00 | |||||||||
| Free cash flow (T + 1) | 4 | |||||||||
| Terminal Value | 53 | |||||||||
| Present Terminal Value | 33 | |||||||||
| Enterprise Value | 59 | |||||||||
| Net Debt | 38 | |||||||||
| Equity Value | 21 | |||||||||
| Diluted Shares Outstanding, MM | 9 | |||||||||
| Equity Value Per Share | 2.33 |
What You Will Get
- Pre-Filled Financial Model: William Penn Bancorporation’s (WMPN) actual data provides an accurate DCF valuation.
- Full Forecast Control: Modify revenue growth, margins, WACC, and other essential drivers to fit your analysis.
- Instant Calculations: Real-time updates allow you to see results immediately as you adjust inputs.
- Investor-Ready Template: A polished Excel file crafted for high-quality valuation presentations.
- Customizable and Reusable: Designed for adaptability, enabling multiple uses for comprehensive forecasts.
Key Features
- Customizable Financial Inputs: Adjust essential parameters such as loan growth, interest rates, and operating expenses.
- Instant DCF Valuation: Quickly determines intrinsic value, net present value, and other key metrics.
- High-Precision Analysis: Leverages William Penn Bancorporation's (WMPN) actual financial data for accurate valuation results.
- Streamlined Scenario Testing: Easily evaluate various assumptions and analyze different outcomes.
- Efficiency Booster: Avoid the hassle of crafting intricate valuation models from the ground up.
How It Works
- Step 1: Download the prebuilt Excel template featuring William Penn Bancorporation’s (WMPN) data.
- Step 2: Review the pre-filled sheets to grasp the essential metrics.
- Step 3: Adjust forecasts and assumptions in the editable yellow cells (WACC, growth, margins).
- Step 4: Instantly see the updated results, including the intrinsic value of William Penn Bancorporation (WMPN).
- Step 5: Use the outputs to make informed investment decisions or create detailed reports.
Why Choose This Calculator for William Penn Bancorporation (WMPN)?
- Designed for Financial Experts: A sophisticated tool tailored for analysts, CFOs, and financial consultants.
- Accurate Financial Data: Historical and projected financials for William Penn Bancorporation preloaded for precision.
- Flexible Scenario Analysis: Effortlessly simulate various forecasts and assumptions.
- Transparent Results: Automatically computes intrinsic value, NPV, and essential financial metrics.
- User-Friendly Interface: Comprehensive step-by-step instructions to assist you throughout the process.
Who Should Use This Product?
- Finance Students: Explore financial analysis techniques and apply them using real data related to William Penn Bancorporation (WMPN).
- Academics: Integrate professional financial models into your coursework or research focused on banking institutions.
- Investors: Evaluate your investment strategies and analyze valuation outcomes for William Penn Bancorporation (WMPN).
- Analysts: Enhance your analysis process with a pre-built, customizable DCF model tailored for banking stocks.
- Small Business Owners: Understand how public companies like William Penn Bancorporation (WMPN) are assessed in the financial market.
What the Template Contains
- Operating and Balance Sheet Data: Pre-filled William Penn Bancorporation (WMPN) historical data and forecasts, including revenue, EBITDA, EBIT, and capital expenditures.
- WACC Calculation: A dedicated sheet for Weighted Average Cost of Capital (WACC), including parameters like Beta, risk-free rate, and share price.
- DCF Valuation (Unlevered and Levered): Editable Discounted Cash Flow models showing intrinsic value with detailed calculations.
- Financial Statements: Pre-loaded financial statements (annual and quarterly) to support analysis.
- Key Ratios: Includes profitability, leverage, and efficiency ratios for William Penn Bancorporation (WMPN).
- Dashboard and Charts: Visual summary of valuation outputs and assumptions to analyze results easily.
Disclaimer
All information, articles, and product details provided on this website are for general informational and educational purposes only. We do not claim any ownership over, nor do we intend to infringe upon, any trademarks, copyrights, logos, brand names, or other intellectual property mentioned or depicted on this site. Such intellectual property remains the property of its respective owners, and any references here are made solely for identification or informational purposes, without implying any affiliation, endorsement, or partnership.
We make no representations or warranties, express or implied, regarding the accuracy, completeness, or suitability of any content or products presented. Nothing on this website should be construed as legal, tax, investment, financial, medical, or other professional advice. In addition, no part of this site—including articles or product references—constitutes a solicitation, recommendation, endorsement, advertisement, or offer to buy or sell any securities, franchises, or other financial instruments, particularly in jurisdictions where such activity would be unlawful.
All content is of a general nature and may not address the specific circumstances of any individual or entity. It is not a substitute for professional advice or services. Any actions you take based on the information provided here are strictly at your own risk. You accept full responsibility for any decisions or outcomes arising from your use of this website and agree to release us from any liability in connection with your use of, or reliance upon, the content or products found herein.