
|
Warby Parker Inc. (WRBY) DCF -Bewertung |
Fully Editable: Tailor To Your Needs In Excel Or Sheets
Professional Design: Trusted, Industry-Standard Templates
Investor-Approved Valuation Models
MAC/PC Compatible, Fully Unlocked
No Expertise Is Needed; Easy To Follow
Warby Parker Inc. (WRBY) Bundle
Vereinfachen Sie die Bewertung von Warby Parker Inc. (WRBY) mit diesem anpassbaren DCF -Taschenrechner! Mit Real Warby Parker Inc. (WRBY) Finanzdaten und einstellbaren Prognoseeingaben können Sie Szenarien testen und Warby Parker Inc. (WRBY) in Minuten aufdecken.
What You Will Get
- Real WRBY Financial Data: Pre-filled with Warby Parker’s historical and projected data for precise analysis.
- Fully Editable Template: Modify key inputs like revenue growth, WACC, and EBITDA % with ease.
- Automatic Calculations: See Warby Parker’s intrinsic value update instantly based on your changes.
- Professional Valuation Tool: Designed for investors, analysts, and consultants seeking accurate DCF results.
- User-Friendly Design: Simple structure and clear instructions for all experience levels.
Key Features
- Comprehensive Data: Warby Parker’s historical financial statements and pre-filled projections.
- Customizable Variables: Modify WACC, tax rates, revenue growth, and EBITDA margins.
- Real-Time Insights: Observe Warby Parker’s intrinsic value update instantly.
- Visual Data Representation: Dashboard graphs illustrate valuation outcomes and essential metrics.
- Designed for Precision: A professional tool tailored for analysts, investors, and finance professionals.
How It Works
- Download the Template: Gain immediate access to the Excel-based WRBY DCF Calculator.
- Input Your Assumptions: Modify the yellow-highlighted cells to set growth rates, WACC, margins, and additional parameters.
- Instant Calculations: The model automatically recalculates Warby Parker’s intrinsic value.
- Test Scenarios: Experiment with various assumptions to assess potential changes in valuation.
- Analyze and Decide: Leverage the results to inform your investment or financial analysis.
Why Choose This Calculator for Warby Parker Inc. (WRBY)?
- Accuracy: Utilizes real Warby Parker financials for precise data.
- Flexibility: Tailored for users to easily adjust and experiment with inputs.
- Time-Saving: Avoid the complexities of creating a financial model from the ground up.
- Professional-Grade: Crafted with the expertise and usability expected at the CFO level.
- User-Friendly: Intuitive design makes it accessible for users without extensive financial modeling skills.
Who Should Use This Product?
- Investors: Evaluate Warby Parker’s valuation before making stock transactions.
- CFOs and Financial Analysts: Enhance valuation methodologies and assess financial forecasts.
- Startup Founders: Understand how leading eyewear companies like Warby Parker are valued.
- Consultants: Provide expert valuation reports for clients in the retail sector.
- Students and Educators: Utilize real-world data to learn and teach valuation strategies.
What the Template Contains
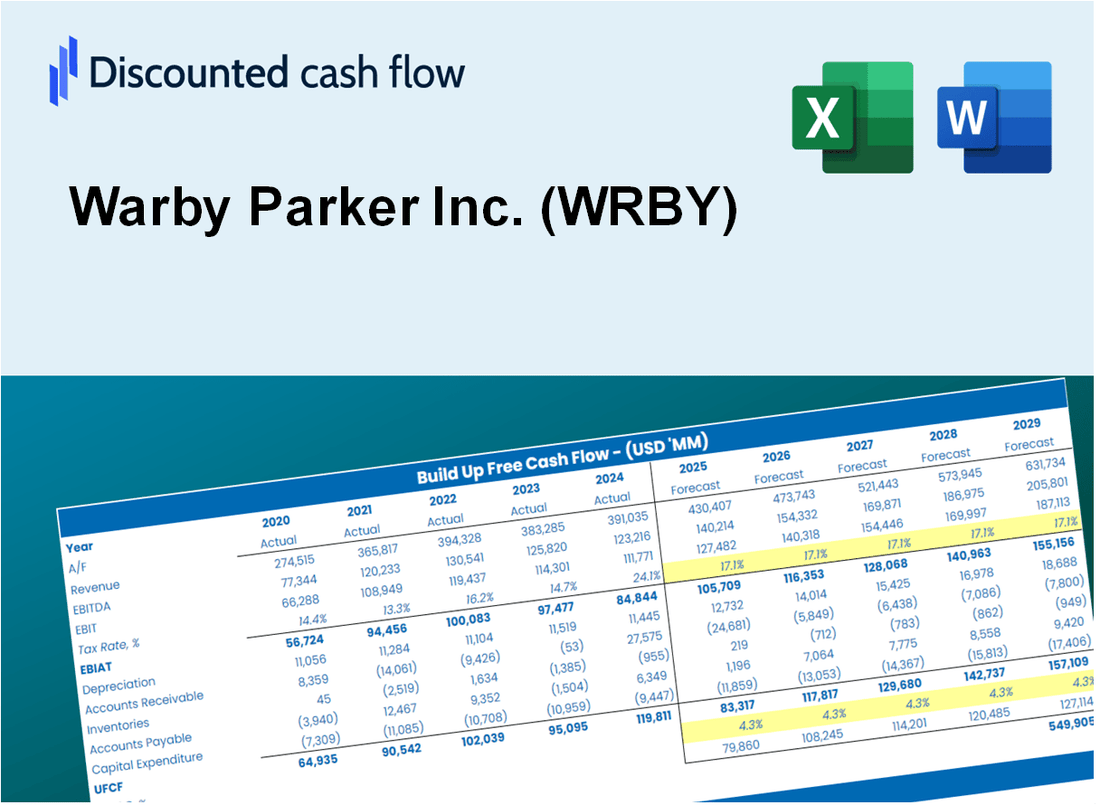
- Operating and Balance Sheet Data: Pre-filled Warby Parker historical data and forecasts, including revenue, EBITDA, EBIT, and capital expenditures.
- WACC Calculation: A dedicated sheet for Weighted Average Cost of Capital (WACC), including parameters like Beta, risk-free rate, and share price.
- DCF Valuation (Unlevered and Levered): Editable Discounted Cash Flow models showing intrinsic value with detailed calculations.
- Financial Statements: Pre-loaded financial statements (annual and quarterly) to support analysis.
- Key Ratios: Includes profitability, leverage, and efficiency ratios for Warby Parker Inc. (WRBY).
- Dashboard and Charts: Visual summary of valuation outputs and assumptions to analyze results easily.
Disclaimer
All information, articles, and product details provided on this website are for general informational and educational purposes only. We do not claim any ownership over, nor do we intend to infringe upon, any trademarks, copyrights, logos, brand names, or other intellectual property mentioned or depicted on this site. Such intellectual property remains the property of its respective owners, and any references here are made solely for identification or informational purposes, without implying any affiliation, endorsement, or partnership.
We make no representations or warranties, express or implied, regarding the accuracy, completeness, or suitability of any content or products presented. Nothing on this website should be construed as legal, tax, investment, financial, medical, or other professional advice. In addition, no part of this site—including articles or product references—constitutes a solicitation, recommendation, endorsement, advertisement, or offer to buy or sell any securities, franchises, or other financial instruments, particularly in jurisdictions where such activity would be unlawful.
All content is of a general nature and may not address the specific circumstances of any individual or entity. It is not a substitute for professional advice or services. Any actions you take based on the information provided here are strictly at your own risk. You accept full responsibility for any decisions or outcomes arising from your use of this website and agree to release us from any liability in connection with your use of, or reliance upon, the content or products found herein.