
|
DCF -Bewertung der United States Steel Corporation (x) |
Fully Editable: Tailor To Your Needs In Excel Or Sheets
Professional Design: Trusted, Industry-Standard Templates
Investor-Approved Valuation Models
MAC/PC Compatible, Fully Unlocked
No Expertise Is Needed; Easy To Follow
United States Steel Corporation (X) Bundle
Entdecken Sie die finanzielle Zukunft der United States Steel Corporation (X) mit unserem benutzerfreundlichen DCF-Taschenrechner! Geben Sie Ihre Annahmen für Wachstum, Margen und Kosten ein, um den inneren Wert der United States Steel Corporation (X) zu bestimmen und formen Sie Ihre Anlagestrategie.
What You Will Get
- Real U.S. Steel Data: Preloaded financials – from revenue to EBIT – based on actual and projected figures for United States Steel Corporation (X).
- Full Customization: Adjust all critical parameters (yellow cells) such as WACC, growth %, and tax rates.
- Instant Valuation Updates: Automatic recalculations to analyze the impact of changes on United States Steel Corporation’s (X) fair value.
- Versatile Excel Template: Designed for quick edits, scenario testing, and detailed projections specific to United States Steel Corporation (X).
- Time-Saving and Accurate: Avoid building models from scratch while ensuring precision and flexibility.
Key Features
- Accurate U.S. Steel Financials: Gain access to reliable pre-loaded historical data and future projections for United States Steel Corporation (X).
- Tailored Forecast Assumptions: Modify yellow-highlighted cells for key metrics such as WACC, growth rates, and profit margins.
- Real-Time Calculations: Automatic updates for DCF, Net Present Value (NPV), and cash flow assessments.
- Interactive Dashboard: User-friendly charts and summaries to effectively visualize your valuation outcomes.
- Designed for All Users: An intuitive layout suitable for investors, CFOs, and consultants, whether seasoned or new.
How It Works
- Download the Template: Gain immediate access to the Excel-based U.S. Steel (X) DCF Calculator.
- Input Your Assumptions: Modify the yellow-highlighted cells for growth rates, WACC, margins, and additional factors.
- Instant Calculations: The model automatically recalculates U.S. Steel’s intrinsic value.
- Test Scenarios: Experiment with various assumptions to assess potential valuation shifts.
- Analyze and Decide: Utilize the findings to inform your investment or financial analysis.
Why Choose United States Steel Corporation (X)?
- Industry Leader: Benefit from a company with a strong reputation in the steel industry.
- Innovative Solutions: Access cutting-edge technologies that enhance product quality and efficiency.
- Sustainable Practices: Committed to eco-friendly operations and reducing carbon footprint.
- Robust Financial Performance: Enjoy stability and growth backed by solid financial metrics.
- Expert Guidance: Rely on a team of professionals dedicated to supporting your needs.
Who Should Use This Product?
- Investors: Evaluate United States Steel Corporation’s (X) valuation prior to making stock trades.
- CFOs and Financial Analysts: Optimize valuation methodologies and assess future projections for United States Steel Corporation (X).
- Startup Founders: Understand the valuation strategies of established companies like United States Steel Corporation (X).
- Consultants: Provide thorough valuation reports for clients interested in United States Steel Corporation (X).
- Students and Educators: Utilize current data to practice and teach valuation methods related to United States Steel Corporation (X).
What the Template Contains
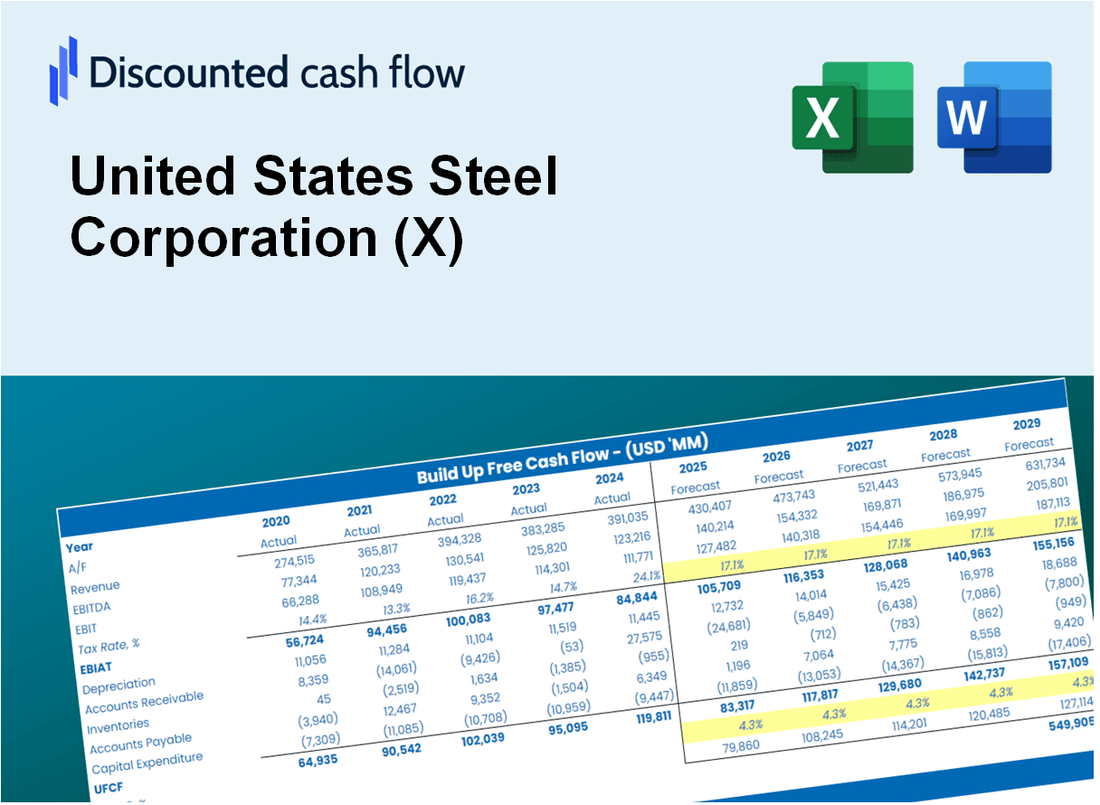
- Operating and Balance Sheet Data: Pre-filled United States Steel Corporation (X) historical data and forecasts, including revenue, EBITDA, EBIT, and capital expenditures.
- WACC Calculation: A dedicated sheet for Weighted Average Cost of Capital (WACC), including parameters like Beta, risk-free rate, and share price.
- DCF Valuation (Unlevered and Levered): Editable Discounted Cash Flow models showing intrinsic value with detailed calculations.
- Financial Statements: Pre-loaded financial statements (annual and quarterly) to support analysis.
- Key Ratios: Includes profitability, leverage, and efficiency ratios for United States Steel Corporation (X).
- Dashboard and Charts: Visual summary of valuation outputs and assumptions to analyze results easily.
Disclaimer
All information, articles, and product details provided on this website are for general informational and educational purposes only. We do not claim any ownership over, nor do we intend to infringe upon, any trademarks, copyrights, logos, brand names, or other intellectual property mentioned or depicted on this site. Such intellectual property remains the property of its respective owners, and any references here are made solely for identification or informational purposes, without implying any affiliation, endorsement, or partnership.
We make no representations or warranties, express or implied, regarding the accuracy, completeness, or suitability of any content or products presented. Nothing on this website should be construed as legal, tax, investment, financial, medical, or other professional advice. In addition, no part of this site—including articles or product references—constitutes a solicitation, recommendation, endorsement, advertisement, or offer to buy or sell any securities, franchises, or other financial instruments, particularly in jurisdictions where such activity would be unlawful.
All content is of a general nature and may not address the specific circumstances of any individual or entity. It is not a substitute for professional advice or services. Any actions you take based on the information provided here are strictly at your own risk. You accept full responsibility for any decisions or outcomes arising from your use of this website and agree to release us from any liability in connection with your use of, or reliance upon, the content or products found herein.