
|
Tsuruha Holdings Inc. (3391.T) Valoración de DCF |
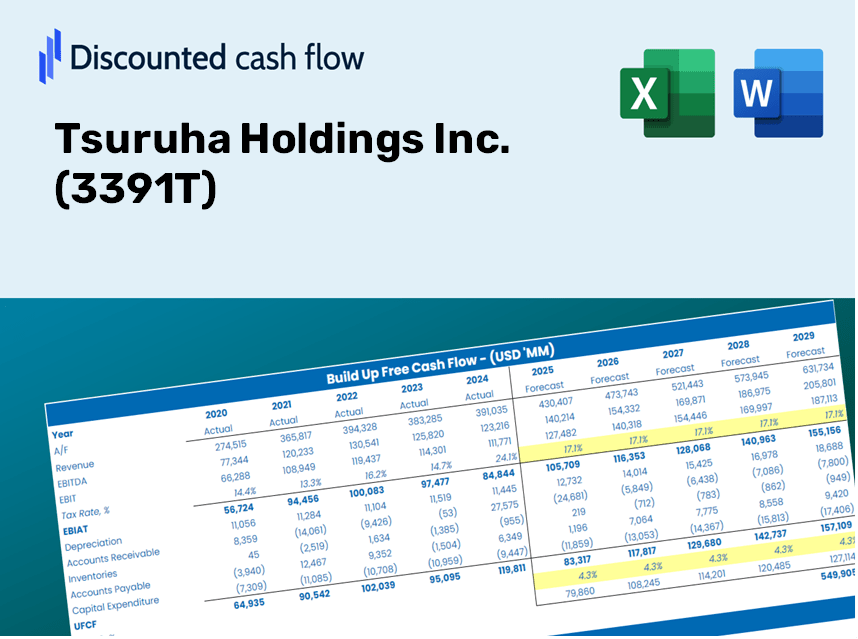
Completamente Editable: Adáptelo A Sus Necesidades En Excel O Sheets
Diseño Profesional: Plantillas Confiables Y Estándares De La Industria
Predeterminadas Para Un Uso Rápido Y Eficiente
Compatible con MAC / PC, completamente desbloqueado
No Se Necesita Experiencia; Fáciles De Seguir
Tsuruha Holdings Inc. (3391.T) Bundle
¡Descubra el verdadero potencial de Tsuruha Holdings Inc. (3391t) con nuestra calculadora DCF avanzada! Ajuste los supuestos esenciales, explore varios escenarios y evalúe cómo los cambios afectan la valoración de Tsuruha Holdings Inc. (3391t), todo dentro de una plantilla de Excel fácil de usar.
Discounted Cash Flow (DCF) - (USD MM)
| Year | AY1 2020 |
AY2 2021 |
AY3 2022 |
AY4 2023 |
AY5 2024 |
FY1 2025 |
FY2 2026 |
FY3 2027 |
FY4 2028 |
FY5 2029 |
|---|---|---|---|---|---|---|---|---|---|---|
| Revenue | 919,303.0 | 915,700.0 | 970,079.0 | 1,027,462.0 | 1,071,683.4 | 1,113,923.4 | 1,157,828.2 | 1,203,463.5 | 1,250,897.5 | 1,300,201.0 |
| Revenue Growth, % | 0 | -0.39193 | 5.94 | 5.92 | 4.3 | 3.94 | 3.94 | 3.94 | 3.94 | 3.94 |
| EBITDA | 59,955.0 | 53,110.0 | 61,311.0 | 57,776.0 | 57,397.5 | 65,990.9 | 68,591.9 | 71,295.4 | 74,105.5 | 77,026.3 |
| EBITDA, % | 6.52 | 5.8 | 6.32 | 5.62 | 5.36 | 5.92 | 5.92 | 5.92 | 5.92 | 5.92 |
| Depreciation | 13,291.0 | 14,663.0 | 16,555.0 | 18,000.0 | 19,593.4 | 18,566.4 | 19,298.2 | 20,058.8 | 20,849.4 | 21,671.2 |
| Depreciation, % | 1.45 | 1.6 | 1.71 | 1.75 | 1.83 | 1.67 | 1.67 | 1.67 | 1.67 | 1.67 |
| EBIT | 46,664.0 | 38,447.0 | 44,756.0 | 39,776.0 | 37,804.1 | 47,424.5 | 49,293.7 | 51,236.6 | 53,256.1 | 55,355.1 |
| EBIT, % | 5.08 | 4.2 | 4.61 | 3.87 | 3.53 | 4.26 | 4.26 | 4.26 | 4.26 | 4.26 |
| Total Cash | 116,531.0 | 127,026.0 | 79,050.0 | 58,688.0 | 92,739.0 | 109,303.4 | 113,611.6 | 118,089.5 | 122,744.0 | 127,581.9 |
| Total Cash, percent | .0 | .0 | .0 | .0 | .0 | .0 | .0 | .0 | .0 | .0 |
| Account Receivables | 46,910.0 | 49,156.0 | 43,934.0 | 47,504.0 | 41,107.0 | 52,263.0 | 54,323.0 | 56,464.1 | 58,689.6 | 61,002.8 |
| Account Receivables, % | 5.1 | 5.37 | 4.53 | 4.62 | 3.84 | 4.69 | 4.69 | 4.69 | 4.69 | 4.69 |
| Inventories | 127,616.0 | 132,435.0 | 140,741.0 | 147,173.0 | 149,194.0 | 158,395.7 | 164,638.8 | 171,128.0 | 177,872.9 | 184,883.7 |
| Inventories, % | 13.88 | 14.46 | 14.51 | 14.32 | 13.92 | 14.22 | 14.22 | 14.22 | 14.22 | 14.22 |
| Accounts Payable | 152,611.0 | 155,660.0 | 108,177.0 | 114,143.0 | 139,398.0 | 153,426.7 | 159,474.0 | 165,759.5 | 172,292.9 | 179,083.7 |
| Accounts Payable, % | 16.6 | 17 | 11.15 | 11.11 | 13.01 | 13.77 | 13.77 | 13.77 | 13.77 | 13.77 |
| Capital Expenditure | -14,748.0 | -23,058.0 | -26,686.0 | -35,380.0 | -20,110.0 | -27,164.5 | -28,235.2 | -29,348.1 | -30,504.8 | -31,707.1 |
| Capital Expenditure, % | -1.6 | -2.52 | -2.75 | -3.44 | -1.88 | -2.44 | -2.44 | -2.44 | -2.44 | -2.44 |
| Tax Rate, % | 39.37 | 39.37 | 39.37 | 39.37 | 39.37 | 39.37 | 39.37 | 39.37 | 39.37 | 39.37 |
| EBITAT | 26,645.0 | 21,843.7 | 26,014.2 | 22,624.6 | 22,920.1 | 27,463.3 | 28,545.8 | 29,670.9 | 30,840.4 | 32,055.9 |
| Depreciation | ||||||||||
| Changes in Account Receivables | ||||||||||
| Changes in Inventories | ||||||||||
| Changes in Accounts Payable | ||||||||||
| Capital Expenditure | ||||||||||
| UFCF | 3,273.0 | 9,432.7 | -34,683.8 | 1,208.6 | 52,034.5 | 12,536.2 | 17,353.0 | 18,037.0 | 18,747.9 | 19,486.8 |
| WACC, % | 4.02 | 4.02 | 4.04 | 4.02 | 4.07 | 4.03 | 4.03 | 4.03 | 4.03 | 4.03 |
| PV UFCF | ||||||||||
| SUM PV UFCF | 76,097.5 | |||||||||
| Long Term Growth Rate, % | 2.00 | |||||||||
| Free cash flow (T + 1) | 19,877 | |||||||||
| Terminal Value | 977,124 | |||||||||
| Present Terminal Value | 801,806 | |||||||||
| Enterprise Value | 877,904 | |||||||||
| Net Debt | -28,842 | |||||||||
| Equity Value | 906,746 | |||||||||
| Diluted Shares Outstanding, MM | 49 | |||||||||
| Equity Value Per Share | 18,589.62 |
What You Will Receive
- Authentic 3391T Financial Data: Pre-populated with Tsuruha Holdings' historical and forecasted data for accurate analysis.
- Completely Customizable Template: Easily adjust essential inputs such as revenue growth, WACC, and EBITDA percentage.
- Instant Calculations: Watch Tsuruha Holdings' intrinsic value refresh immediately based on your modifications.
- Expert Valuation Tool: Tailored for investors, analysts, and consultants aiming for reliable DCF results.
- Intuitive Layout: Straightforward design and clear guidelines suitable for all skill levels.
Key Features
- 🔍 Real-Life TSURU Financials: Pre-filled historical and projected data for Tsuruha Holdings Inc. (3391T).
- ✏️ Fully Customizable Inputs: Adjust all key parameters (yellow cells) such as WACC, growth %, and tax rates.
- 📊 Professional DCF Valuation: Integrated formulas calculate Tsuruha's intrinsic value utilizing the Discounted Cash Flow method.
- ⚡ Instant Results: Visualize Tsuruha's valuation immediately after making adjustments.
- Scenario Analysis: Evaluate and compare outcomes for different financial assumptions side-by-side.
How It Works
- Step 1: Download the Excel file.
- Step 2: Review the pre-filled Tsuruha Holdings Inc. (3391T) data (historical and projected).
- Step 3: Modify the key assumptions (yellow cells) based on your insights.
- Step 4: Observe the automatic recalculations for Tsuruha Holdings Inc.'s intrinsic value.
- Step 5: Utilize the results for investment strategies or reporting purposes.
Why Opt for This Calculator?
- All-in-One Solution: Features DCF, WACC, and financial ratio analyses for a comprehensive evaluation.
- Flexible Inputs: Modify yellow-highlighted cells to explore different financial scenarios.
- In-Depth Analysis: Automatically computes the intrinsic value and Net Present Value of Tsuruha Holdings Inc. (3391T).
- Preloaded Information: Access historical and projected data for precise starting points.
- High-Quality Standards: Tailored for financial analysts, investors, and business consultants.
Who Should Consider Tsuruha Holdings Inc. (3391T)?
- Investors: Make informed decisions with a robust valuation tool designed for accuracy.
- Financial Analysts: Streamline your workflow with a customizable DCF model already set up for rapid use.
- Consultants: Effortlessly tailor the template for engaging client presentations or detailed reports.
- Finance Enthusiasts: Enhance your knowledge of valuation methods through practical, real-world applications.
- Educators and Students: Utilize it as an effective resource for finance education and hands-on learning.
Contents of the Template
- Pre-Populated Data: Contains Tsuruha Holdings Inc.'s historical financial performance and projections.
- Discounted Cash Flow Model: An editable DCF valuation model with automated calculations.
- Weighted Average Cost of Capital (WACC): A separate section for calculating WACC based on user-defined inputs.
- Essential Financial Ratios: Assess Tsuruha’s profitability, efficiency, and financial leverage.
- Customizable Parameters: Easily adjust revenue growth, profit margins, and tax rates.
- Comprehensive Dashboard: Visual representations and tables summarizing key valuation outcomes.
Disclaimer
All information, articles, and product details provided on this website are for general informational and educational purposes only. We do not claim any ownership over, nor do we intend to infringe upon, any trademarks, copyrights, logos, brand names, or other intellectual property mentioned or depicted on this site. Such intellectual property remains the property of its respective owners, and any references here are made solely for identification or informational purposes, without implying any affiliation, endorsement, or partnership.
We make no representations or warranties, express or implied, regarding the accuracy, completeness, or suitability of any content or products presented. Nothing on this website should be construed as legal, tax, investment, financial, medical, or other professional advice. In addition, no part of this site—including articles or product references—constitutes a solicitation, recommendation, endorsement, advertisement, or offer to buy or sell any securities, franchises, or other financial instruments, particularly in jurisdictions where such activity would be unlawful.
All content is of a general nature and may not address the specific circumstances of any individual or entity. It is not a substitute for professional advice or services. Any actions you take based on the information provided here are strictly at your own risk. You accept full responsibility for any decisions or outcomes arising from your use of this website and agree to release us from any liability in connection with your use of, or reliance upon, the content or products found herein.