
|
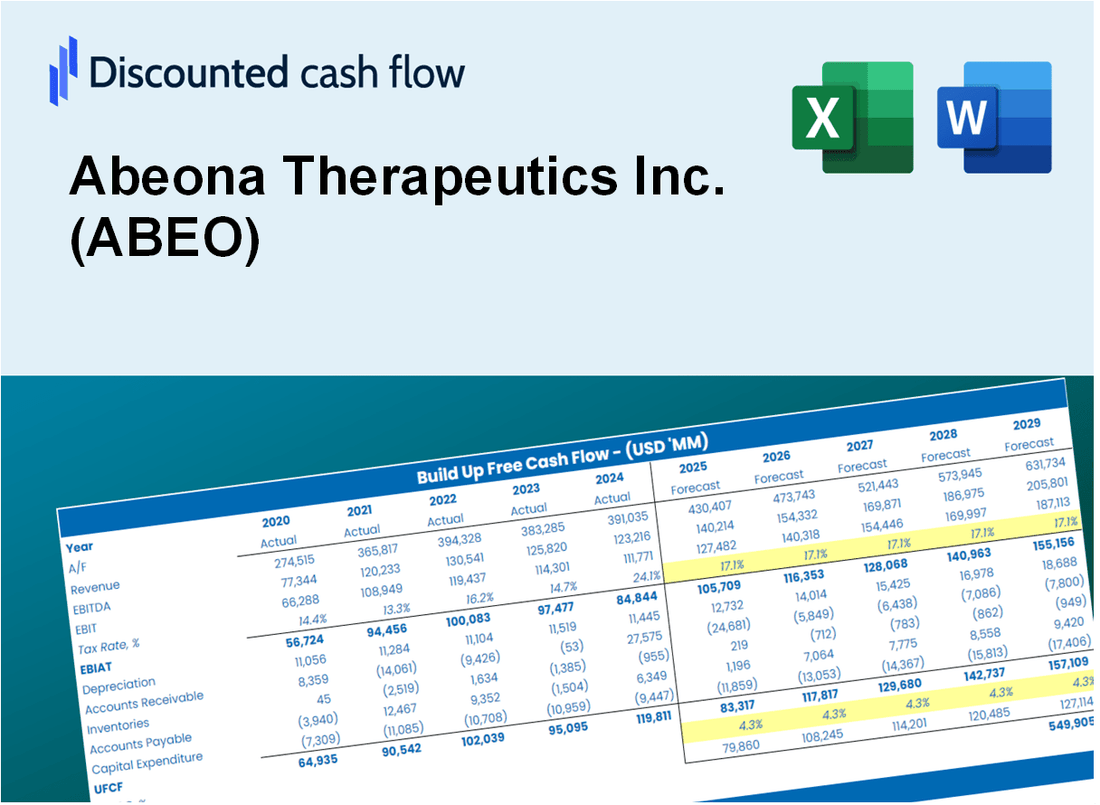
Valoración DCF de Abeona Therapeutics Inc. (ABEO) |
Completamente Editable: Adáptelo A Sus Necesidades En Excel O Sheets
Diseño Profesional: Plantillas Confiables Y Estándares De La Industria
Predeterminadas Para Un Uso Rápido Y Eficiente
Compatible con MAC / PC, completamente desbloqueado
No Se Necesita Experiencia; Fáciles De Seguir
Abeona Therapeutics Inc. (ABEO) Bundle
¡Mejore sus estrategias de inversión con la calculadora DCF de Abeona Therapeutics Inc. (ABEO)! Utilice datos financieros reales de Abeona, ajuste las proyecciones y gastos de crecimiento, y observe instantáneamente cómo estas modificaciones afectan el valor intrínseco de Abeona Therapeutics Inc. (ABEO).
Discounted Cash Flow (DCF) - (USD MM)
| Year | AY1 2020 |
AY2 2021 |
AY3 2022 |
AY4 2023 |
AY5 2024 |
FY1 2025 |
FY2 2026 |
FY3 2027 |
FY4 2028 |
FY5 2029 |
|---|---|---|---|---|---|---|---|---|---|---|
| Revenue | 10.0 | 3.0 | 1.4 | 3.5 | .0 | .0 | .0 | .0 | .0 | .0 |
| Revenue Growth, % | 0 | -70 | -52.87 | 147.52 | -100 | -30.72 | -30.72 | -30.72 | -30.72 | -30.72 |
| EBITDA | -74.5 | -76.8 | -34.4 | -50.6 | -56.6 | .0 | .0 | .0 | .0 | .0 |
| EBITDA, % | -745.18 | -2560.53 | -2431.61 | -1444.91 | 100 | -60 | -60 | -60 | -60 | -60 |
| Depreciation | 5.6 | 4.5 | 4.6 | 3.2 | 2.9 | .0 | .0 | .0 | .0 | .0 |
| Depreciation, % | 56.01 | 148.8 | 323.69 | 91.37 | 100 | 89.48 | 89.48 | 89.48 | 89.48 | 89.48 |
| EBIT | -80.1 | -81.3 | -39.0 | -53.8 | -59.5 | .0 | .0 | .0 | .0 | .0 |
| EBIT, % | -801.19 | -2709.33 | -2755.3 | -1536.29 | 100 | -60 | -60 | -60 | -60 | -60 |
| Total Cash | 95.0 | 45.0 | 52.1 | 52.2 | 97.7 | .0 | .0 | .0 | .0 | .0 |
| Total Cash, percent | .0 | .0 | .0 | .0 | .0 | .0 | .0 | .0 | .0 | .0 |
| Account Receivables | .0 | 3.0 | .2 | 2.4 | 1.7 | .0 | .0 | .0 | .0 | .0 |
| Account Receivables, % | 0 | 100 | 13.3 | 69.83 | 100 | 56.62 | 56.62 | 56.62 | 56.62 | 56.62 |
| Inventories | .0 | .0 | .0 | .0 | .0 | .0 | .0 | .0 | .0 | .0 |
| Inventories, % | 0 | 0 | 0 | 0 | 100 | 20 | 20 | 20 | 20 | 20 |
| Accounts Payable | 4.7 | 4.3 | 1.8 | 1.9 | 3.4 | .0 | .0 | .0 | .0 | .0 |
| Accounts Payable, % | 46.95 | 144.17 | 128.08 | 53.09 | 100 | 80.01 | 80.01 | 80.01 | 80.01 | 80.01 |
| Capital Expenditure | -1.3 | -4.2 | -.1 | -.3 | -2.4 | .0 | .0 | .0 | .0 | .0 |
| Capital Expenditure, % | -13.36 | -138.37 | -9.19 | -9.46 | 100 | -26.4 | -26.4 | -26.4 | -26.4 | -26.4 |
| Tax Rate, % | 0 | 0 | 0 | 0 | 0 | 0 | 0 | 0 | 0 | 0 |
| EBITAT | -80.1 | -81.3 | -39.0 | -53.8 | -59.5 | .0 | .0 | .0 | .0 | .0 |
| Depreciation | ||||||||||
| Changes in Account Receivables | ||||||||||
| Changes in Inventories | ||||||||||
| Changes in Accounts Payable | ||||||||||
| Capital Expenditure | ||||||||||
| UFCF | -71.2 | -84.3 | -34.2 | -53.1 | -56.7 | -1.8 | .0 | .0 | .0 | .0 |
| WACC, % | 10.06 | 10.06 | 10.06 | 10.06 | 10.06 | 10.06 | 10.06 | 10.06 | 10.06 | 10.06 |
| PV UFCF | ||||||||||
| SUM PV UFCF | -1.6 | |||||||||
| Long Term Growth Rate, % | 2.00 | |||||||||
| Free cash flow (T + 1) | 0 | |||||||||
| Terminal Value | 0 | |||||||||
| Present Terminal Value | 0 | |||||||||
| Enterprise Value | -2 | |||||||||
| Net Debt | 0 | |||||||||
| Equity Value | -1 | |||||||||
| Diluted Shares Outstanding, MM | 41 | |||||||||
| Equity Value Per Share | -0.03 |
What You Will Receive
- Authentic Abeona Data: Preloaded financials – from revenue to EBIT – based on actual and projected figures.
- Complete Customization: Modify all essential parameters (yellow cells) such as WACC, growth %, and tax rates.
- Immediate Valuation Updates: Automatic recalculations to assess the effects of changes on Abeona's fair value.
- Flexible Excel Template: Designed for quick edits, scenario analysis, and comprehensive projections.
- Efficient and Precise: Avoid the hassle of building models from the ground up while ensuring accuracy and adaptability.
Key Features
- Comprehensive Financial Data: Gain access to precise historical performance and future forecasts for Abeona Therapeutics Inc. (ABEO).
- Adjustable Forecast Parameters: Modify highlighted fields such as WACC, growth rates, and profit margins to fit your analysis.
- Real-Time Calculations: Enjoy automatic updates for DCF, Net Present Value (NPV), and cash flow evaluations.
- Interactive Dashboard: Utilize user-friendly charts and summaries to easily interpret your valuation findings.
- Designed for All Users: An intuitive layout suitable for investors, CFOs, and consultants, regardless of experience level.
How It Works
- Download the Template: Gain immediate access to the Excel-based ABEO DCF Calculator.
- Input Your Assumptions: Modify the yellow-highlighted cells for growth rates, WACC, margins, and additional parameters.
- Instant Calculations: The model automatically recalculates Abeona Therapeutics’ intrinsic value.
- Test Scenarios: Experiment with different assumptions to assess potential changes in valuation.
- Analyze and Decide: Utilize the outcomes to inform your investment or financial analysis.
Why Choose This Calculator for Abeona Therapeutics Inc. (ABEO)?
- Accurate Data: Access to real-time Abeona Therapeutics financials ensures dependable valuation outcomes.
- Customizable: Tailor essential parameters such as growth rates, WACC, and tax rates to align with your forecasts.
- Time-Saving: Pre-configured calculations save you the effort of building from the ground up.
- Professional-Grade Tool: Crafted for investors, analysts, and consultants in the biotech sector.
- User-Friendly: An intuitive interface and guided instructions make it accessible for all users.
Who Should Use This Product?
- Individual Investors: Make informed decisions about buying or selling Abeona Therapeutics Inc. (ABEO) stock.
- Financial Analysts: Streamline valuation processes with ready-to-use financial models specific to Abeona Therapeutics Inc. (ABEO).
- Consultants: Deliver professional valuation insights on Abeona Therapeutics Inc. (ABEO) to clients quickly and accurately.
- Business Owners: Understand how biotech companies like Abeona Therapeutics Inc. (ABEO) are valued to guide your own strategy.
- Finance Students: Learn valuation techniques using real-world data and scenarios related to Abeona Therapeutics Inc. (ABEO).
What the Template Contains
- Pre-Filled Data: Includes Abeona Therapeutics Inc.'s (ABEO) historical financials and forecasts.
- Discounted Cash Flow Model: Editable DCF valuation model with automatic calculations.
- Weighted Average Cost of Capital (WACC): A dedicated sheet for calculating WACC based on custom inputs.
- Key Financial Ratios: Analyze Abeona Therapeutics Inc.'s (ABEO) profitability, efficiency, and leverage.
- Customizable Inputs: Edit revenue growth, margins, and tax rates with ease.
- Clear Dashboard: Charts and tables summarizing key valuation results.
Disclaimer
All information, articles, and product details provided on this website are for general informational and educational purposes only. We do not claim any ownership over, nor do we intend to infringe upon, any trademarks, copyrights, logos, brand names, or other intellectual property mentioned or depicted on this site. Such intellectual property remains the property of its respective owners, and any references here are made solely for identification or informational purposes, without implying any affiliation, endorsement, or partnership.
We make no representations or warranties, express or implied, regarding the accuracy, completeness, or suitability of any content or products presented. Nothing on this website should be construed as legal, tax, investment, financial, medical, or other professional advice. In addition, no part of this site—including articles or product references—constitutes a solicitation, recommendation, endorsement, advertisement, or offer to buy or sell any securities, franchises, or other financial instruments, particularly in jurisdictions where such activity would be unlawful.
All content is of a general nature and may not address the specific circumstances of any individual or entity. It is not a substitute for professional advice or services. Any actions you take based on the information provided here are strictly at your own risk. You accept full responsibility for any decisions or outcomes arising from your use of this website and agree to release us from any liability in connection with your use of, or reliance upon, the content or products found herein.