
|
Valoración DCF de Artisan Partners Asset Management Inc. (APAM) |
Completamente Editable: Adáptelo A Sus Necesidades En Excel O Sheets
Diseño Profesional: Plantillas Confiables Y Estándares De La Industria
Predeterminadas Para Un Uso Rápido Y Eficiente
Compatible con MAC / PC, completamente desbloqueado
No Se Necesita Experiencia; Fáciles De Seguir
Artisan Partners Asset Management Inc. (APAM) Bundle
¿Busca evaluar el valor intrínseco de Artisan Partners Asset Management Inc.? Nuestra calculadora DCF (APAM) integra datos del mundo real con extensas características de personalización, lo que le permite refinar sus proyecciones y mejorar sus opciones de inversión.
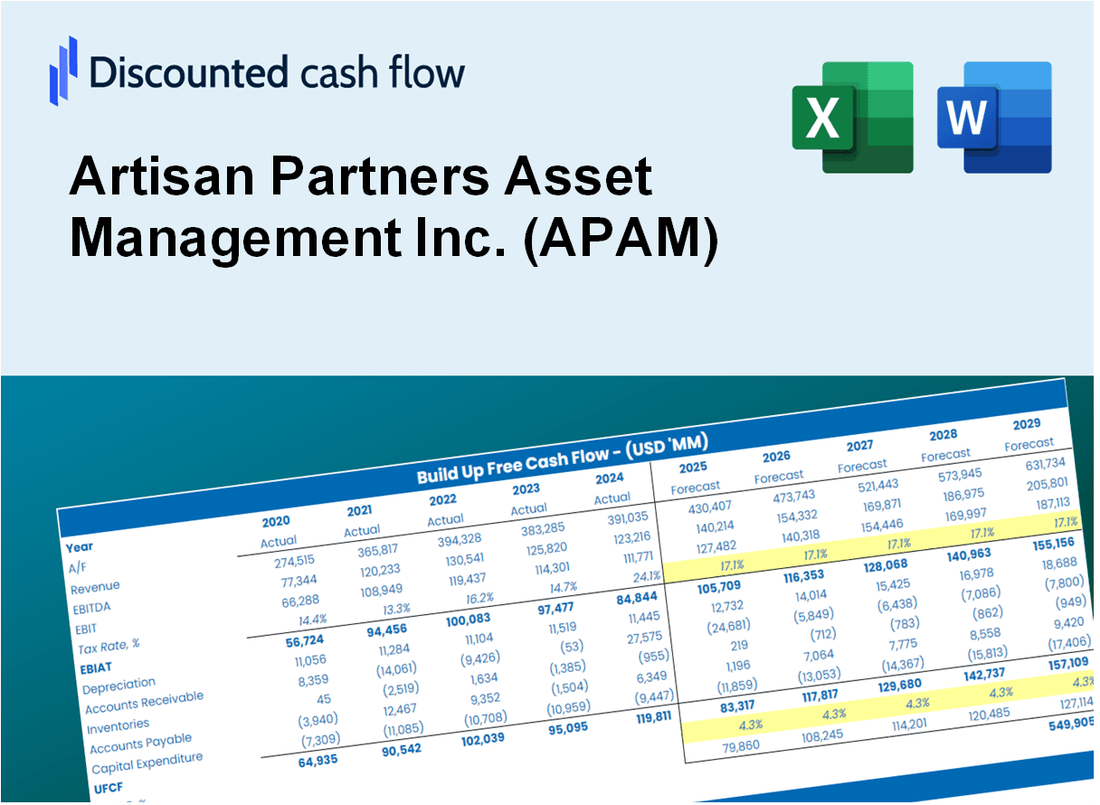
Discounted Cash Flow (DCF) - (USD MM)
| Year | AY1 2020 |
AY2 2021 |
AY3 2022 |
AY4 2023 |
AY5 2024 |
FY1 2025 |
FY2 2026 |
FY3 2027 |
FY4 2028 |
FY5 2029 |
|---|---|---|---|---|---|---|---|---|---|---|
| Revenue | 899.6 | 1,227.2 | 993.3 | 975.1 | 1,111.8 | 1,193.9 | 1,282.1 | 1,376.9 | 1,478.6 | 1,587.8 |
| Revenue Growth, % | 0 | 36.43 | -19.06 | -1.83 | 14.02 | 7.39 | 7.39 | 7.39 | 7.39 | 7.39 |
| EBITDA | 386.7 | 569.3 | 329.5 | 395.3 | 449.4 | 486.0 | 521.9 | 560.4 | 601.8 | 646.3 |
| EBITDA, % | 42.99 | 46.39 | 33.18 | 40.54 | 40.42 | 40.7 | 40.7 | 40.7 | 40.7 | 40.7 |
| Depreciation | 6.6 | 6.9 | 7.8 | 9.3 | 9.9 | 9.4 | 10.1 | 10.8 | 11.6 | 12.5 |
| Depreciation, % | 0.73647 | 0.56493 | 0.78497 | 0.95864 | 0.88703 | 0.78641 | 0.78641 | 0.78641 | 0.78641 | 0.78641 |
| EBIT | 380.1 | 562.4 | 321.7 | 386.0 | 439.6 | 476.6 | 511.8 | 549.6 | 590.2 | 633.8 |
| EBIT, % | 42.25 | 45.82 | 32.39 | 39.58 | 39.53 | 39.92 | 39.92 | 39.92 | 39.92 | 39.92 |
| Total Cash | 198.8 | 200.1 | 143.2 | 178.5 | 268.2 | 227.5 | 244.3 | 262.3 | 281.7 | 302.5 |
| Total Cash, percent | .0 | .0 | .0 | .0 | .0 | .0 | .0 | .0 | .0 | .0 |
| Account Receivables | 103.5 | 122.3 | 103.6 | 114.5 | 127.7 | 131.6 | 141.3 | 151.8 | 163.0 | 175.0 |
| Account Receivables, % | 11.5 | 9.96 | 10.43 | 11.74 | 11.48 | 11.02 | 11.02 | 11.02 | 11.02 | 11.02 |
| Inventories | -2.2 | -6.0 | .0 | .0 | .0 | -1.8 | -1.9 | -2.0 | -2.2 | -2.3 |
| Inventories, % | -0.24645 | -0.48687 | 0 | 0 | 0 | -0.14666 | -0.14666 | -0.14666 | -0.14666 | -0.14666 |
| Accounts Payable | 128.8 | 42.8 | 46.8 | 60.8 | 135.0 | 97.7 | 104.9 | 112.6 | 120.9 | 129.9 |
| Accounts Payable, % | 14.32 | 3.49 | 4.71 | 6.24 | 12.14 | 8.18 | 8.18 | 8.18 | 8.18 | 8.18 |
| Capital Expenditure | -3.1 | -6.0 | -19.6 | -8.6 | -4.8 | -9.8 | -10.5 | -11.3 | -12.2 | -13.1 |
| Capital Expenditure, % | -0.3445 | -0.48621 | -1.97 | -0.88511 | -0.42741 | -0.82245 | -0.82245 | -0.82245 | -0.82245 | -0.82245 |
| Tax Rate, % | 41.04 | 41.04 | 41.04 | 41.04 | 41.04 | 41.04 | 41.04 | 41.04 | 41.04 | 41.04 |
| EBITAT | 218.8 | 343.1 | 213.3 | 223.6 | 259.2 | 287.6 | 308.9 | 331.7 | 356.2 | 382.5 |
| Depreciation | ||||||||||
| Changes in Account Receivables | ||||||||||
| Changes in Inventories | ||||||||||
| Changes in Accounts Payable | ||||||||||
| Capital Expenditure | ||||||||||
| UFCF | 249.9 | 243.0 | 218.3 | 227.4 | 325.3 | 247.7 | 306.1 | 328.7 | 352.9 | 379.0 |
| WACC, % | 11.09 | 11.1 | 11.12 | 11.09 | 11.09 | 11.1 | 11.1 | 11.1 | 11.1 | 11.1 |
| PV UFCF | ||||||||||
| SUM PV UFCF | 1,166.2 | |||||||||
| Long Term Growth Rate, % | 2.00 | |||||||||
| Free cash flow (T + 1) | 387 | |||||||||
| Terminal Value | 4,249 | |||||||||
| Present Terminal Value | 2,511 | |||||||||
| Enterprise Value | 3,677 | |||||||||
| Net Debt | 32 | |||||||||
| Equity Value | 3,644 | |||||||||
| Diluted Shares Outstanding, MM | 65 | |||||||||
| Equity Value Per Share | 56.12 |
What You Will Receive
- Adjustable Forecast Parameters: Effortlessly modify assumptions (growth %, margins, WACC) to explore various scenarios.
- Comprehensive Data: Artisan Partners’ financial information pre-loaded to facilitate your analysis.
- Automated DCF Calculations: The template computes Net Present Value (NPV) and intrinsic value automatically.
- Tailored and Professional: A refined Excel model that can be customized according to your valuation requirements.
- Designed for Analysts and Investors: Perfect for evaluating projections, confirming strategies, and enhancing efficiency.
Key Features
- Authentic Financial Data: Gain access to precise pre-loaded historical figures and future forecasts for Artisan Partners Asset Management Inc. (APAM).
- Tailorable Projection Assumptions: Modify highlighted cells for key metrics such as WACC, growth rates, and profit margins.
- Real-Time Calculations: Automatic recalculations for DCF, Net Present Value (NPV), and cash flow assessments.
- Interactive Dashboard: User-friendly charts and summaries to help visualize your valuation outcomes.
- Designed for All Levels: A straightforward, intuitive layout suitable for investors, CFOs, and consultants alike.
How It Works
- Download: Access the comprehensive Excel file featuring Artisan Partners Asset Management Inc.'s (APAM) financial data.
- Customize: Tailor forecasts, including revenue growth, EBITDA %, and WACC to fit your analysis.
- Update Automatically: Enjoy real-time updates for intrinsic value and NPV calculations.
- Test Scenarios: Generate various projections and compare results instantly.
- Make Decisions: Leverage the valuation insights to inform your investment strategy.
Why Choose This Calculator for Artisan Partners Asset Management Inc. (APAM)?
- Accurate Data: Utilize real financial metrics from Artisan Partners for dependable valuation outcomes.
- Customizable: Modify essential variables such as growth rates, WACC, and tax rates to align with your forecasts.
- Time-Saving: Pre-configured calculations save you the hassle of starting from the ground up.
- Professional-Grade Tool: Tailored for investors, analysts, and financial consultants.
- User-Friendly: Easy-to-navigate interface and clear instructions make it accessible for everyone.
Who Should Use This Product?
- Individual Investors: Gain insights to make informed decisions about investing in Artisan Partners Asset Management Inc. (APAM).
- Financial Analysts: Enhance your analysis with comprehensive data and financial models tailored for Artisan Partners Asset Management Inc. (APAM).
- Consultants: Provide clients with expert valuation assessments related to Artisan Partners Asset Management Inc. (APAM) efficiently.
- Business Owners: Learn about the valuation methods used for asset management firms like Artisan Partners Asset Management Inc. (APAM) to inform your business strategies.
- Finance Students: Study real-world valuation practices using Artisan Partners Asset Management Inc. (APAM) as a case example.
What the Template Contains
- Preloaded APAM Data: Historical and projected financial data, including revenue, EBIT, and capital expenditures.
- DCF and WACC Models: Professional-grade sheets for calculating intrinsic value and Weighted Average Cost of Capital.
- Editable Inputs: Yellow-highlighted cells for adjusting revenue growth, tax rates, and discount rates.
- Financial Statements: Comprehensive annual and quarterly financials for deeper analysis.
- Key Ratios: Profitability, leverage, and efficiency ratios to evaluate performance.
- Dashboard and Charts: Visual summaries of valuation outcomes and assumptions.
Disclaimer
All information, articles, and product details provided on this website are for general informational and educational purposes only. We do not claim any ownership over, nor do we intend to infringe upon, any trademarks, copyrights, logos, brand names, or other intellectual property mentioned or depicted on this site. Such intellectual property remains the property of its respective owners, and any references here are made solely for identification or informational purposes, without implying any affiliation, endorsement, or partnership.
We make no representations or warranties, express or implied, regarding the accuracy, completeness, or suitability of any content or products presented. Nothing on this website should be construed as legal, tax, investment, financial, medical, or other professional advice. In addition, no part of this site—including articles or product references—constitutes a solicitation, recommendation, endorsement, advertisement, or offer to buy or sell any securities, franchises, or other financial instruments, particularly in jurisdictions where such activity would be unlawful.
All content is of a general nature and may not address the specific circumstances of any individual or entity. It is not a substitute for professional advice or services. Any actions you take based on the information provided here are strictly at your own risk. You accept full responsibility for any decisions or outcomes arising from your use of this website and agree to release us from any liability in connection with your use of, or reliance upon, the content or products found herein.