
|
Valoración DCF de Compass Diversified (CODI) |
Completamente Editable: Adáptelo A Sus Necesidades En Excel O Sheets
Diseño Profesional: Plantillas Confiables Y Estándares De La Industria
Predeterminadas Para Un Uso Rápido Y Eficiente
Compatible con MAC / PC, completamente desbloqueado
No Se Necesita Experiencia; Fáciles De Seguir
Compass Diversified (CODI) Bundle
¡Evalúe la perspectiva financiera de Compass diversificada como un experto! Esta calculadora DCF (CODI) le proporciona finanzas preladas y la capacidad de modificar sin esfuerzo el crecimiento de los ingresos, WACC, los márgenes y otros supuestos esenciales para alinearse con sus proyecciones.
What You Will Get
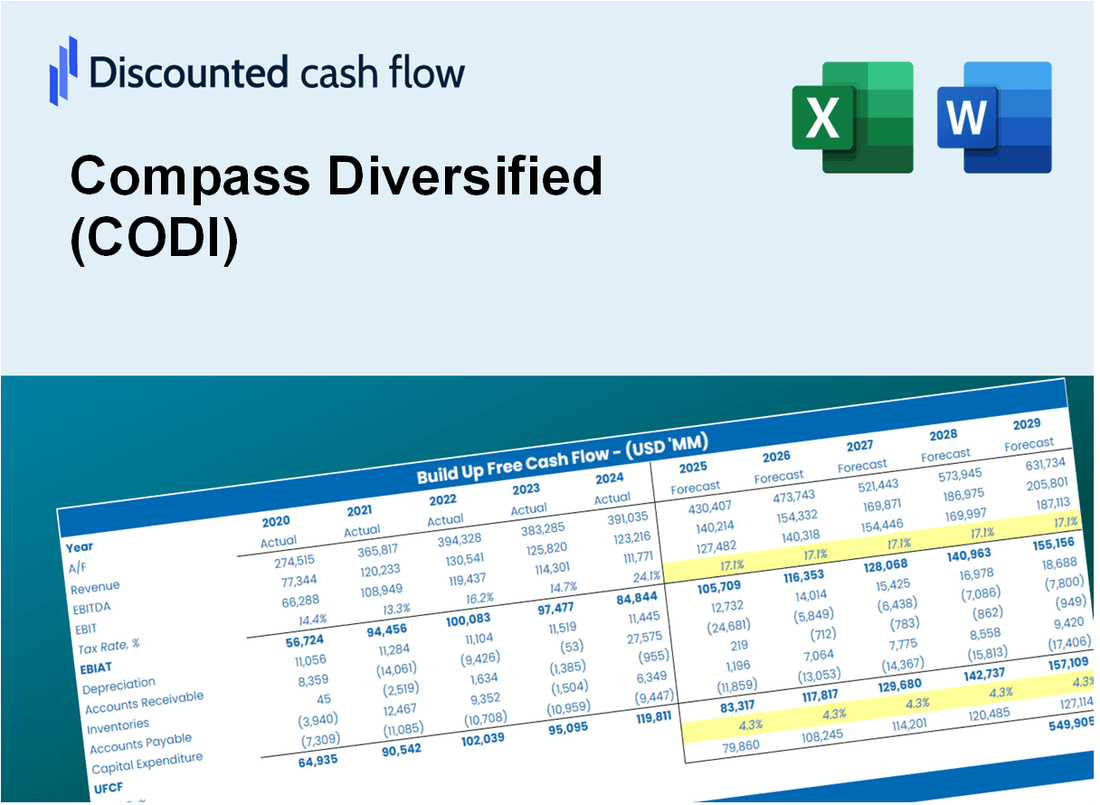
- Real Compass Diversified Data: Preloaded financials – from revenue to EBIT – based on actual and projected figures for CODI (CODI).
- Full Customization: Adjust all critical parameters (yellow cells) like WACC, growth %, and tax rates specific to CODI (CODI).
- Instant Valuation Updates: Automatic recalculations to analyze the impact of changes on Compass Diversified’s fair value.
- Versatile Excel Template: Tailored for quick edits, scenario testing, and detailed projections for CODI (CODI).
- Time-Saving and Accurate: Skip building models from scratch while maintaining precision and flexibility for CODI (CODI).
Key Features
- Pre-Loaded Data: Compass Diversified’s historical financial statements and pre-filled forecasts.
- Fully Adjustable Inputs: Modify WACC, tax rates, revenue growth, and EBITDA margins as needed.
- Instant Results: Observe Compass Diversified’s intrinsic value recalculating in real time.
- Clear Visual Outputs: Dashboard charts showcase valuation results and essential metrics.
- Built for Accuracy: A professional tool designed for analysts, investors, and finance professionals.
How It Works
- Download: Get the pre-built Excel file featuring Compass Diversified's (CODI) financial data.
- Customize: Modify forecasts such as revenue growth, EBITDA %, and WACC as needed.
- Update Automatically: The intrinsic value and NPV calculations refresh in real-time.
- Test Scenarios: Generate various projections and instantly compare the results.
- Make Decisions: Leverage the valuation outcomes to inform your investment strategy.
Why Choose This Calculator for Compass Diversified (CODI)?
- Comprehensive Tool: Features DCF, WACC, and financial ratio analyses all in one convenient package.
- Customizable Inputs: Modify yellow-highlighted cells to explore different financial scenarios.
- Detailed Insights: Automatically computes Compass Diversified’s intrinsic value and Net Present Value.
- Preloaded Data: Access to historical and projected data for reliable starting points.
- Professional Quality: Perfect for financial analysts, investors, and business consultants.
Who Should Use This Product?
- Professional Investors: Create comprehensive and accurate valuation models for portfolio assessments involving Compass Diversified (CODI).
- Corporate Finance Teams: Evaluate valuation scenarios to inform strategic decisions within their organizations.
- Consultants and Advisors: Deliver precise valuation insights to clients interested in Compass Diversified (CODI) investments.
- Students and Educators: Utilize real-time data to enhance learning and practice in financial modeling.
- Finance Enthusiasts: Gain insights into how companies like Compass Diversified (CODI) are appraised in the market.
What the Template Contains
- Historical Data: Includes Compass Diversified’s (CODI) past financials and baseline forecasts.
- DCF and Levered DCF Models: Detailed templates to calculate Compass Diversified’s (CODI) intrinsic value.
- WACC Sheet: Pre-built calculations for Weighted Average Cost of Capital.
- Editable Inputs: Modify key drivers like growth rates, EBITDA %, and CAPEX assumptions.
- Quarterly and Annual Statements: A complete breakdown of Compass Diversified’s (CODI) financials.
- Interactive Dashboard: Visualize valuation results and projections dynamically.
Disclaimer
All information, articles, and product details provided on this website are for general informational and educational purposes only. We do not claim any ownership over, nor do we intend to infringe upon, any trademarks, copyrights, logos, brand names, or other intellectual property mentioned or depicted on this site. Such intellectual property remains the property of its respective owners, and any references here are made solely for identification or informational purposes, without implying any affiliation, endorsement, or partnership.
We make no representations or warranties, express or implied, regarding the accuracy, completeness, or suitability of any content or products presented. Nothing on this website should be construed as legal, tax, investment, financial, medical, or other professional advice. In addition, no part of this site—including articles or product references—constitutes a solicitation, recommendation, endorsement, advertisement, or offer to buy or sell any securities, franchises, or other financial instruments, particularly in jurisdictions where such activity would be unlawful.
All content is of a general nature and may not address the specific circumstances of any individual or entity. It is not a substitute for professional advice or services. Any actions you take based on the information provided here are strictly at your own risk. You accept full responsibility for any decisions or outcomes arising from your use of this website and agree to release us from any liability in connection with your use of, or reliance upon, the content or products found herein.