
|
Coromandel International Limited (Coromandel.NS) Valoración de DCF |
Completamente Editable: Adáptelo A Sus Necesidades En Excel O Sheets
Diseño Profesional: Plantillas Confiables Y Estándares De La Industria
Predeterminadas Para Un Uso Rápido Y Eficiente
Compatible con MAC / PC, completamente desbloqueado
No Se Necesita Experiencia; Fáciles De Seguir
Coromandel International Limited (COROMANDEL.NS) Bundle
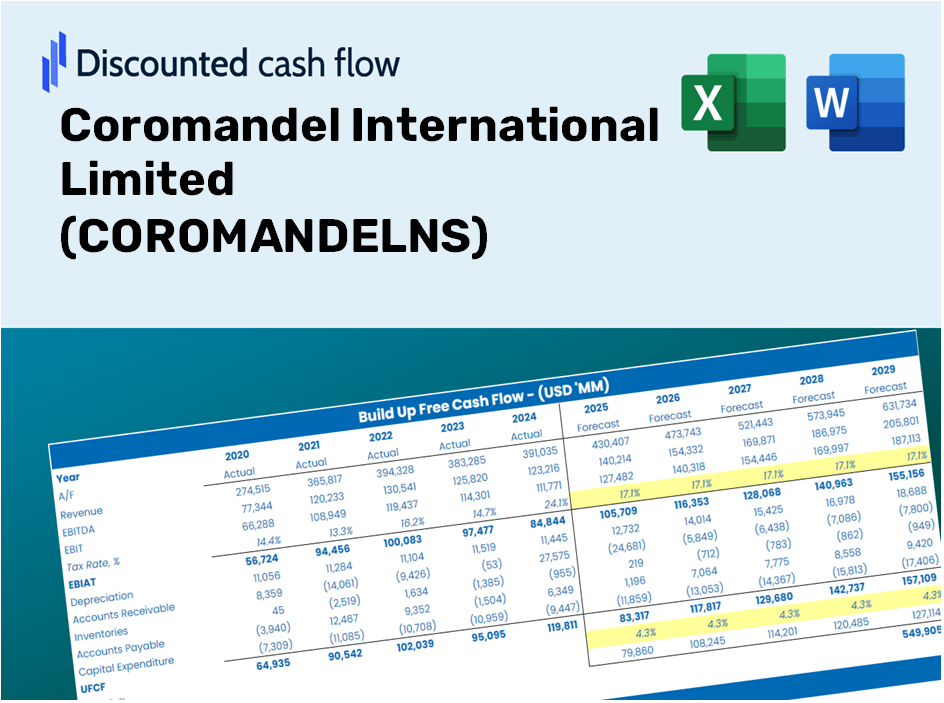
Diseñada para la precisión, nuestra calculadora DCF (Coromandelns) le permite evaluar la valoración de Coromandel International Limited utilizando datos financieros del mundo real, ofreciendo una flexibilidad completa para modificar todos los parámetros esenciales para proyecciones mejoradas.
Discounted Cash Flow (DCF) - (USD MM)
| Year | AY1 2021 |
AY2 2022 |
AY3 2023 |
AY4 2024 |
AY5 2025 |
FY1 2026 |
FY2 2027 |
FY3 2028 |
FY4 2029 |
FY5 2030 |
|---|---|---|---|---|---|---|---|---|---|---|
| Revenue | 141,819.5 | 191,108.5 | 296,279.0 | 220,583.9 | 240,852.4 | 285,064.8 | 337,393.1 | 399,327.1 | 472,630.2 | 559,389.2 |
| Revenue Growth, % | 0 | 34.75 | 55.03 | -25.55 | 9.19 | 18.36 | 18.36 | 18.36 | 18.36 | 18.36 |
| EBITDA | 20,010.5 | 21,803.5 | 30,532.1 | 24,015.9 | 26,655.1 | 32,941.2 | 38,988.1 | 46,145.0 | 54,615.6 | 64,641.2 |
| EBITDA, % | 14.11 | 11.41 | 10.31 | 10.89 | 11.07 | 11.56 | 11.56 | 11.56 | 11.56 | 11.56 |
| Depreciation | 1,360.9 | 1,342.5 | 1,426.3 | 1,857.2 | 2,408.0 | 2,272.1 | 2,689.2 | 3,182.8 | 3,767.1 | 4,458.6 |
| Depreciation, % | 0.9596 | 0.70248 | 0.4814 | 0.84195 | 0.99978 | 0.79704 | 0.79704 | 0.79704 | 0.79704 | 0.79704 |
| EBIT | 18,649.6 | 20,461.0 | 29,105.8 | 22,158.7 | 24,247.1 | 30,669.1 | 36,298.9 | 42,962.2 | 50,848.6 | 60,182.6 |
| EBIT, % | 13.15 | 10.71 | 9.82 | 10.05 | 10.07 | 10.76 | 10.76 | 10.76 | 10.76 | 10.76 |
| Total Cash | 6,921.0 | 17,303.1 | 13,938.6 | 35,596.8 | 43,999.1 | 30,242.2 | 35,793.6 | 42,364.1 | 50,140.7 | 59,344.9 |
| Total Cash, percent | .0 | .0 | .0 | .0 | .0 | .0 | .0 | .0 | .0 | .0 |
| Account Receivables | 5,544.2 | 24,091.3 | 39,842.6 | 13,935.4 | 12,290.9 | 23,594.1 | 27,925.1 | 33,051.2 | 39,118.3 | 46,299.2 |
| Account Receivables, % | 3.91 | 12.61 | 13.45 | 6.32 | 5.1 | 8.28 | 8.28 | 8.28 | 8.28 | 8.28 |
| Inventories | 26,008.8 | 36,632.3 | 44,164.5 | 46,125.0 | 47,699.1 | 53,095.5 | 62,842.0 | 74,377.7 | 88,030.9 | 104,190.5 |
| Inventories, % | 18.34 | 19.17 | 14.91 | 20.91 | 19.8 | 18.63 | 18.63 | 18.63 | 18.63 | 18.63 |
| Accounts Payable | 29,221.6 | 39,135.4 | 53,137.7 | 53,606.4 | 60,300.1 | 61,777.0 | 73,117.2 | 86,539.0 | 102,424.7 | 121,226.4 |
| Accounts Payable, % | 20.6 | 20.48 | 17.94 | 24.3 | 25.04 | 21.67 | 21.67 | 21.67 | 21.67 | 21.67 |
| Capital Expenditure | -1,950.4 | -2,779.2 | -6,052.4 | -5,268.9 | -8,506.4 | -6,153.3 | -7,282.8 | -8,619.7 | -10,201.9 | -12,074.7 |
| Capital Expenditure, % | -1.38 | -1.45 | -2.04 | -2.39 | -3.53 | -2.16 | -2.16 | -2.16 | -2.16 | -2.16 |
| Tax Rate, % | 24.24 | 24.24 | 24.24 | 24.24 | 24.24 | 24.24 | 24.24 | 24.24 | 24.24 | 24.24 |
| EBITAT | 13,879.5 | 15,257.4 | 21,692.5 | 16,627.7 | 18,370.2 | 22,960.2 | 27,174.9 | 32,163.4 | 38,067.5 | 45,055.4 |
| Depreciation | ||||||||||
| Changes in Account Receivables | ||||||||||
| Changes in Inventories | ||||||||||
| Changes in Accounts Payable | ||||||||||
| Capital Expenditure | ||||||||||
| UFCF | 10,958.6 | -5,436.1 | 7,785.2 | 37,631.4 | 19,035.9 | 3,856.4 | 19,843.9 | 23,486.6 | 27,797.9 | 32,900.7 |
| WACC, % | 4.92 | 4.93 | 4.93 | 4.93 | 4.93 | 4.93 | 4.93 | 4.93 | 4.93 | 4.93 |
| PV UFCF | ||||||||||
| SUM PV UFCF | 90,833.7 | |||||||||
| Long Term Growth Rate, % | 2.00 | |||||||||
| Free cash flow (T + 1) | 33,559 | |||||||||
| Terminal Value | 1,146,766 | |||||||||
| Present Terminal Value | 901,678 | |||||||||
| Enterprise Value | 992,512 | |||||||||
| Net Debt | -27,580 | |||||||||
| Equity Value | 1,020,091 | |||||||||
| Diluted Shares Outstanding, MM | 295 | |||||||||
| Equity Value Per Share | 3,461.57 |
What You Will Receive
- Genuine COROMANDEL Financials: Access to historical and projected data for precise valuation.
- Customizable Inputs: Adjust WACC, tax rates, revenue growth, and capital expenditure assumptions.
- Automated Calculations: Intrinsic value and NPV are calculated in real-time.
- Scenario Analysis: Explore various scenarios to assess COROMANDEL's future performance.
- User-Friendly Design: Designed for professionals while remaining accessible to newcomers.
Key Features
- Pre-Loaded Data: Coromandel International Limited’s historical financial statements and pre-filled forecasts.
- Fully Adjustable Inputs: Modify WACC, tax rates, revenue growth, and EBITDA margins.
- Instant Results: View Coromandel’s intrinsic value recalibrated in real time.
- Clear Visual Outputs: Dashboard charts showcase valuation results and essential metrics.
- Built for Accuracy: A professional-grade tool for analysts, investors, and finance professionals.
How It Functions
- Download: Obtain the pre-formatted Excel file containing Coromandel International Limited’s (COROMANDELNS) financial data.
- Customize: Modify key forecasts such as revenue growth, EBITDA percentage, and WACC.
- Update Automatically: The intrinsic value and NPV calculations refresh in real time.
- Test Scenarios: Generate multiple projections and evaluate outcomes on the spot.
- Make Decisions: Utilize the valuation insights to inform your investment approach.
Why Opt for This Calculator?
- Reliable Data: Current financial metrics from Coromandel International Limited (COROMANDELNS) guarantee trustworthy valuation outcomes.
- Customizable Options: Tailor essential variables such as growth rates, WACC, and tax rates to align with your forecasts.
- Efficiency: Built-in calculations save you the hassle of starting from scratch.
- Professional-Quality Tool: Ideal for investors, analysts, and consultancy professionals.
- User-Centric: An intuitive design and clear, step-by-step guidance ensure ease of use for everyone.
Who Can Benefit from Coromandel International Limited (COROMANDELNS)?
- Investors: Make informed decisions with a top-tier valuation tool tailored for your needs.
- Financial Analysts: Streamline your workflow with a customizable DCF model designed for efficiency.
- Consultants: Effortlessly modify the template for impactful client presentations or detailed reports.
- Finance Enthusiasts: Enhance your grasp of valuation methods through practical, real-world applications.
- Educators and Students: Utilize this resource as a valuable learning aid in finance courses.
Contents of the Template
- Operating and Balance Sheet Data: Pre-filled historical data and projections for Coromandel International Limited (COROMANDELNS), covering revenue, EBITDA, EBIT, and capital expenditures.
- WACC Calculation: A dedicated sheet for calculating the Weighted Average Cost of Capital (WACC), incorporating key parameters such as Beta, risk-free rate, and stock price.
- DCF Valuation (Unlevered and Levered): Customizable Discounted Cash Flow models that present intrinsic value with comprehensive calculations.
- Financial Statements: Pre-populated annual and quarterly financial statements to facilitate analysis.
- Key Ratios: Features profitability, leverage, and efficiency ratios specific to Coromandel International Limited (COROMANDELNS).
- Dashboard and Charts: A visual overview of valuation outcomes and assumptions, making it easy to analyze results.
Disclaimer
All information, articles, and product details provided on this website are for general informational and educational purposes only. We do not claim any ownership over, nor do we intend to infringe upon, any trademarks, copyrights, logos, brand names, or other intellectual property mentioned or depicted on this site. Such intellectual property remains the property of its respective owners, and any references here are made solely for identification or informational purposes, without implying any affiliation, endorsement, or partnership.
We make no representations or warranties, express or implied, regarding the accuracy, completeness, or suitability of any content or products presented. Nothing on this website should be construed as legal, tax, investment, financial, medical, or other professional advice. In addition, no part of this site—including articles or product references—constitutes a solicitation, recommendation, endorsement, advertisement, or offer to buy or sell any securities, franchises, or other financial instruments, particularly in jurisdictions where such activity would be unlawful.
All content is of a general nature and may not address the specific circumstances of any individual or entity. It is not a substitute for professional advice or services. Any actions you take based on the information provided here are strictly at your own risk. You accept full responsibility for any decisions or outcomes arising from your use of this website and agree to release us from any liability in connection with your use of, or reliance upon, the content or products found herein.