
|
Viant Technology Inc. (DSP): Análisis de 5 Fuerzas [Actualizado en Ene-2025] |
Completamente Editable: Adáptelo A Sus Necesidades En Excel O Sheets
Diseño Profesional: Plantillas Confiables Y Estándares De La Industria
Predeterminadas Para Un Uso Rápido Y Eficiente
Compatible con MAC / PC, completamente desbloqueado
No Se Necesita Experiencia; Fáciles De Seguir
Viant Technology Inc. (DSP) Bundle
En el panorama de publicidad digital en rápida evolución, Viant Technology Inc. se encuentra en la encrucijada de la innovación y la competencia, navegando por un ecosistema complejo donde convergen la destreza tecnológica, el posicionamiento estratégico y la dinámica del mercado. Al diseccionar el entorno competitivo de la compañía a través del marco de las cinco fuerzas de Michael Porter, descubriremos los intrincados desafíos y oportunidades que dan forma a la trayectoria estratégica de Viant en el $ 400 mil millones Mercado de publicidad digital global, revelando las fuerzas matizadas que determinarán su éxito en 2024 y más allá.
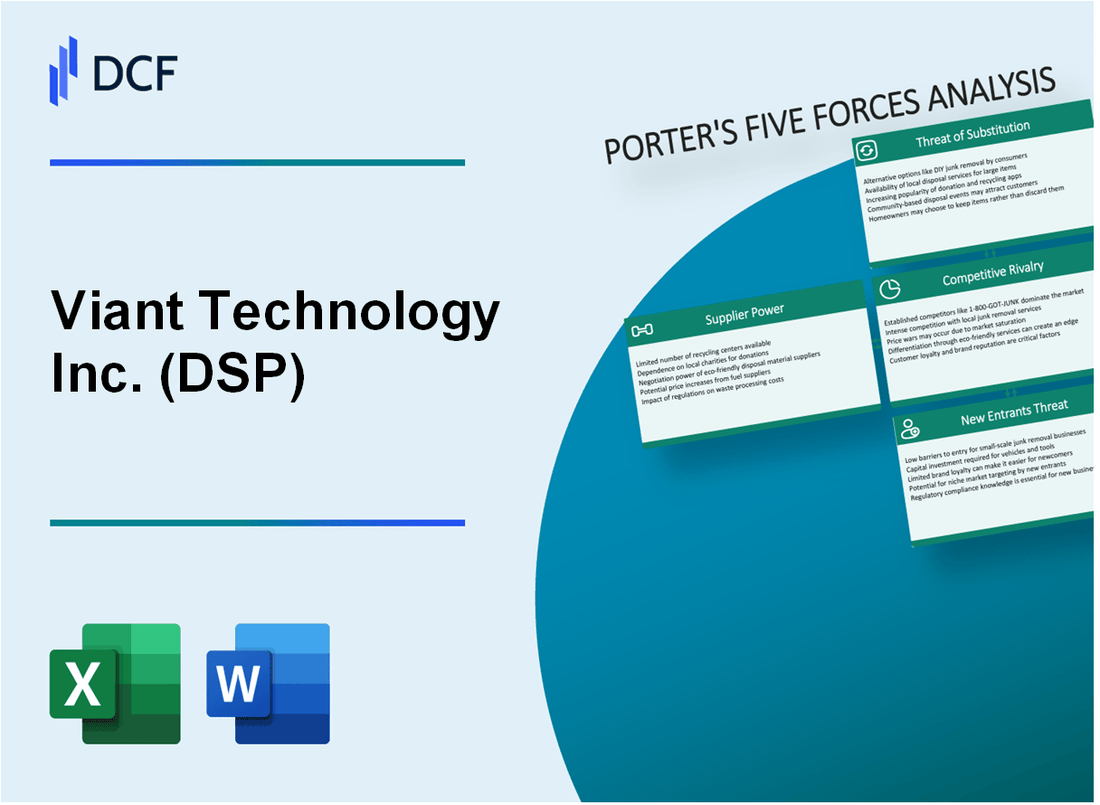
Viant Technology Inc. (DSP) - Las cinco fuerzas de Porter: poder de negociación de los proveedores
Panorama de proveedores de tecnología publicitaria especializada
A partir del cuarto trimestre de 2023, Viant Technology Inc. opera en un mercado con aproximadamente 12-15 proveedores especializados de tecnología publicitaria y tecnología de publicidad programática a nivel mundial.
| Categoría de proveedor | Número de proveedores | Impacto de la cuota de mercado |
|---|---|---|
| Proveedores de infraestructura en la nube | 3-4 proveedores principales | Alta concentración |
| Plataformas de gestión de datos | 7-9 vendedores significativos | Concentración moderada |
| Proveedores de tecnología programática | 5-6 proveedores especializados | Competencia moderada |
Complejidad tecnológica y apalancamiento del proveedor
La complejidad tecnológica en la publicidad programática crea barreras de entrada significativas, con costos de desarrollo estimados que van desde $ 2.5 millones a $ 5 millones para tecnologías DSP avanzadas.
- Costos de cambio promedio para componentes de tecnología central: $ 750,000 - $ 1.2 millones
- Complejidad de integración: 4-6 meses Línea de tiempo de implementación típica
- Se requiere experiencia técnica: equipos de ingeniería especializados con experiencia en publicidad programática
Dependencias de infraestructura en la nube
La tecnología VIANT se basa en los principales proveedores de la nube con la siguiente distribución del mercado:
| Proveedor de nubes | Cuota de mercado | Costo anual estimado |
|---|---|---|
| Servicios web de Amazon | 62% | $ 3.4 millones |
| Microsoft Azure | 23% | $ 1.2 millones |
| Plataforma en la nube de Google | 15% | $800,000 |
Dinámica de negociación de precios del proveedor
El precio potencial aumenta el riesgo de los proveedores estimados en 7-12% anuales, con complejidad tecnológica que limita la sustitución rápida.
- Palancamiento de negociación: moderado
- Concentración de proveedores: alto en segmentos de tecnología crítica
- Costos de cambio: barreras técnicas y financieras significativas
Viant Technology Inc. (DSP) - Las cinco fuerzas de Porter: poder de negociación de los clientes
Gran energía de negociación de clientes empresariales
Viant Technology Inc. reportó 161 clientes empresariales a partir del tercer trimestre de 2023, con los 10 principales clientes que representan el 37% de los ingresos totales. El valor promedio del contrato para grandes empresas fue de $ 524,000 en 2023.
Dinámica de comparación del mercado publicitario
| Plataforma | Cuota de mercado | Flexibilidad de precios |
|---|---|---|
| DSP VIGN | 4.2% | Moderado |
| Trato | 12.7% | Alto |
| Administrador de anuncios de Google | 22.5% | Alto |
Sensibilidad de precios en publicidad programática
El ecosistema de publicidad programática muestra el 18.3% de sensibilidad al precio entre los clientes, con un costo promedio por mil impresiones (CPM) que varían entre $ 2.80 y $ 4.50 en 2023.
Capacidades de conmutación de clientes
- Tiempo de migración promedio de la plataforma del cliente: 45-60 días
- Costos de integración de la plataforma: $ 35,000 - $ 75,000
- Duración típica del contrato: 12-24 meses
Enfoque publicitario basado en personas
La tecnología de identificación doméstica de Viant cubre 130 millones de hogares, potencialmente reduciendo la probabilidad de conmutación de clientes en un 22% en comparación con las plataformas de publicidad digital tradicionales.
Viant Technology Inc. (DSP) - Las cinco fuerzas de Porter: rivalidad competitiva
Panorama competitivo del mercado
A partir del cuarto trimestre de 2023, Viant Technology Inc. enfrenta una intensa competencia en el mercado de tecnología de publicidad digital con los siguientes competidores clave:
| Competidor | Posición de mercado | Ingresos anuales (2023) |
|---|---|---|
| La mesa de comercio | Competidor principal de DSP | $ 1.2 mil millones |
| Mediamath | Plataforma de publicidad programática directa | $ 327 millones |
| Plataforma de marketing de Google | Jugador de mercado dominante | $ 42.6 mil millones |
Dinámica competitiva
Métricas de concentración de mercado para el sector de tecnología de publicidad digital:
- Tamaño total del mercado direccionable: $ 526.1 mil millones para 2024
- Tasa de crecimiento del mercado de tecnología de publicidad digital: 17.2% anual
- Número de plataformas DSP activas a nivel mundial: 36
Métricas de innovación
Indicadores de innovación competitiva para la tecnología Viant:
- Inversión de I + D: $ 24.7 millones en 2023
- Solicitudes de patentes presentadas: 7 en resolución de identidad digital
- Cobertura tecnológica de resolución de identidad basada en personas: 225 millones de perfiles de consumo únicos
Tendencias de consolidación de la industria
Estadísticas de consolidación de la industria de la tecnología publicitaria:
| Métrico | Valor 2023 |
|---|---|
| Transacciones totales de M&A | 42 transacciones |
| Valor total de transacciones de M&A | $ 3.6 mil millones |
| Tamaño de transacción promedio | $ 85.7 millones |
Viant Technology Inc. (DSP) - Las cinco fuerzas de Porter: amenaza de sustitutos
Canales de marketing digital alternativos
En 2023, el mercado de publicidad en redes sociales alcanzó los $ 262 mil millones a nivel mundial. Las alternativas de marketing digital incluyen:
- Anuncios de Facebook: $ 114.93 mil millones de ingresos en 2022
- ADS de Google: $ 224.47 mil millones de ingresos en 2022
- Publicidad de LinkedIn: ingresos de $ 3.8 mil millones en 2022
- Publicidad de Tiktok: $ 11.7 mil millones de ingresos en 2023
| Plataforma | 2023 ingresos publicitarios | Cuota de mercado |
|---|---|---|
| $ 114.93 mil millones | 22.3% | |
| $ 224.47 mil millones | 43.4% | |
| Tiktok | $ 11.7 mil millones | 2.3% |
Tecnologías emergentes
El mercado de plataformas de marketing impulsadas por la IA se proyectó para alcanzar los $ 107.3 mil millones para 2028.
- API CHATGPT: ingresos mensuales de $ 200 millones
- Soluciones de marketing de Google AI: ingresos anuales de $ 45.2 mil millones
- Herramientas de marketing de Microsoft AI: ingresos anuales de $ 38.7 mil millones
Medios publicitarios tradicionales
| Medio | 2023 ingresos | Penetración del mercado |
|---|---|---|
| Publicidad televisiva | $ 178.6 mil millones | 34.5% |
| Publicidad por radio | $ 33.5 mil millones | 6.5% |
| Publicidad impresa | $ 44.2 mil millones | 8.6% |
Soluciones de marketing centradas en la privacidad
Se espera que el mercado de la tecnología de marketing de privacidad alcance los $ 18.5 mil millones para 2026.
- Herramientas de privacidad de Apple: ingresos de $ 5.6 mil millones
- Google Privacy Sandbox: inversión de $ 3.2 mil millones
- Plataformas de anuncios centradas en la privacidad: mercado de $ 2.7 mil millones
Estrategias de datos de primera parte
| Estrategia de datos | Valor de mercado 2023 | Índice de crecimiento |
|---|---|---|
| Plataformas de datos de primera parte | $ 12.3 mil millones | 24.6% |
| Plataformas de datos de clientes | $ 4.9 mil millones | 18.3% |
Viant Technology Inc. (DSP) - Las cinco fuerzas de Porter: amenaza de nuevos participantes
Requisitos iniciales de capital para el desarrollo de la plataforma de tecnología publicitaria
Viant Technology Inc. requiere aproximadamente $ 25-50 millones en inversión de capital inicial para el desarrollo integral de la plataforma DSP. El informe financiero 2023 de la Compañía indica gastos de I + D de $ 18.3 millones asignados específicamente a la infraestructura tecnológica.
Barreras de entrada de infraestructura tecnológica
| Componente tecnológico | Costo de desarrollo estimado | Nivel de complejidad |
|---|---|---|
| Algoritmos de aprendizaje automático | $ 5-8 millones | Alto |
| Infraestructura de procesamiento de datos | $ 7-12 millones | Muy alto |
| Sistemas de licitación en tiempo real | $ 3-6 millones | Alto |
Efectos de la red y relaciones con los clientes
La tecnología VIANT se mantiene actualmente 247 clientes de nivel empresarial Con un valor contractual promedio de $ 1.2 millones, creando barreras de entrada sustanciales para los posibles competidores.
Desafíos de cumplimiento regulatorio
- Costos de cumplimiento de GDPR: $ 500,000- $ 1.5 millones anuales
- Gastos de implementación de CCPA: $ 350,000- $ 750,000
- Inversión de infraestructura de privacidad de datos: $ 2-4 millones
Aprendizaje automático y inversión en infraestructura de datos
La inversión de infraestructura de datos 2023 de VIANT Technology totalizó un total $ 22.7 millones, que representa el 34% del gasto operativo total.
Viant Technology Inc. (DSP) - Porter's Five Forces: Competitive rivalry
You're looking at a market where Viant Technology Inc. (DSP) is definitely fighting an uphill battle on scale. The competitive rivalry in the demand-side platform (DSP) space is fierce, driven by the sheer size of the incumbents. Giants like Google and Amazon are constantly evolving their own DSP offerings, making it tough for a challenger like Viant Technology to gain significant traction in terms of overall spend share. To put the scale in perspective, back in 2023, Google held a digital ad market share of 28.6%, translating to annual ad revenue of about $237.9 billion, while Amazon commanded 11.3% of that market, or $38.2 billion in annual ad revenue. Viant Technology's 2023 revenue was reported at $89.4 million, representing just 0.2% of that same market. That's a massive gap in resources for R&D and market penetration.
Direct, specialized competitors are also applying intense pressure. The Trade Desk and StackAdapt are frequently cited as key rivals in the independent DSP landscape. You see this rivalry play out in user sentiment scores, too. For instance, on G2 user reviews, The Trade Desk scores higher in areas like Machine Learning Optimization at 8.4 compared to Viant Technology's 7.6, and in Brand Safety at 8.7 versus Viant Technology's 8.2. It's a constant feature comparison battle. Here's a quick look at how Viant Technology stacks up against one of its most direct, publicly-traded peers based on some historical context and recent performance indicators:
| Metric | Viant Technology (DSP) | The Trade Desk (TTD) |
|---|---|---|
| 2023 Market Cap (Approx.) | $121.62 million | $33.14 billion |
| Gross Margin (Historical Comparison) | Lower | Significantly Higher |
| R&D as % of Revenue (Historical Comparison) | Lower (e.g., 12.6% in 2023) | Higher |
| G2 Score: Campaign Optimization | 8.0 | 8.5 |
Viant Technology's Q3 2025 revenue hit $85.58 million. Honestly, that number, while a record for the third quarter, is small when you look at the annual run-rate of the giants. Still, the company is fighting hard to carve out its niche. Differentiation is defintely key for Viant Technology to survive and grow in this environment. They are leaning heavily into proprietary technology to create a moat. For example, their Household ID solution, which they claim to have patented back in 2012, was recently upgraded via a partnership with TransUnion to match to 95% of U.S. adults (18+). This focus on people-based, cookieless addressability is a direct counter to the industry shift away from third-party cookies.
The growth figures tell a nuanced story about this rivalry. The reported year-over-year revenue growth for Q3 2025 was only 7%, moving from $79.92 million in Q3 2024 to $85.58 million. That slow reported growth can spook investors. But here's the important context you need to see: when excluding temporary headwinds like political spend and a seasonal advertiser transition, the underlying revenue growth was 19% year-over-year. Furthermore, their Connected TV (CTV) business remains a massive tailwind, with record CTV advertiser spend representing 46% of total advertiser spend in Q3 2025. Viant Technology is also rolling out its AI-powered tools, with the third phase of the ViantAI product suite, AI Measurement and Analysis, launching to improve reporting. You have to watch how quickly they can scale adoption of these unique tools.
- Viant Technology Q3 2025 Revenue: $85.58 million.
- Q3 2025 YoY Revenue Growth (Reported): 7%.
- Q3 2025 YoY Revenue Growth (Excluding Headwinds): 19%.
- CTV Spend as % of Total Ad Spend (Q3 2025): 46%.
- Household ID Match Rate (with TransUnion): 95% of U.S. adults (18+).
- Contribution ex-TAC (Q3 2025): $53.0 million, up 12% YoY.
If onboarding those new AI features takes longer than expected, churn risk rises.
Viant Technology Inc. (DSP) - Porter's Five Forces: Threat of substitutes
The threat of substitutes for Viant Technology Inc. (DSP) is substantial because advertisers have numerous, often massive, alternative channels to allocate their budgets. These substitutes range from the dominant walled gardens to legacy media, all vying for the same marketing dollars.
High Threat from Walled Gardens and Social Media
The largest substitution threat comes from the major walled gardens, like Meta and Google Ads, where advertisers can commit billions of dollars for highly targeted campaigns. Social media advertising represents a massive alternative spend pool. While the prompt mentions a specific figure, real-life data shows significant scale in this area. One projection estimates the global social media advertising market size to reach $136.65 billion by 2025. Another report projects the market to reach $262.62 billion by 2028, indicating a massive, sustained alternative spend channel.
The sheer size of these platforms means they are direct substitutes for the open internet programmatic spend Viant Technology Inc. (DSP) targets. You see this competition in the overall digital landscape:
- Digital ad spending is projected to hit $800 billion globally by 2025.
- Digital channels are expected to capture over 75% of total media ad spend in 2025.
- In 2024, businesses allocated an average of 53.4% of their marketing spend to digital channels, leaving 46.6% for traditional media like TV and radio.
Substitution from Traditional Media Channels
Traditional media, while losing ground, still commands significant budgets, especially for broad brand awareness campaigns. This represents a persistent substitution risk, though the trend favors digital. For instance, traditional TV ad spend is projected to decline by -2.5% Year-over-Year in 2025. However, traditional channels still hold value, as TV advertising during live sporting events can deliver 24% more engagement than regular programming.
Here is a look at the budget allocation dynamics that define the substitution pressure:
| Media Category | Estimated Global Spend/Share (2025) | Trend/Context |
|---|---|---|
| Digital Ad Spending (Total) | Exceed $800 billion (eMarketer) / Over 75% of total spend | Dominant, driven by precision and AI integration |
| Traditional Ad Spending (Total) | Estimated $200 billion (eMarketer) | Dwarfed by digital spend |
| Traditional TV Ad Spend | Declining -2.5% Year-over-Year | Shifting to digital channels like CTV |
In-House Development as a Costly Substitute
A viable, though capital-intensive, substitution is the development of in-house ad technology stacks by large brands. This allows major advertisers to bypass third-party Demand-Side Platforms (DSPs) entirely. While specific development costs are proprietary, general digital marketing budgets for large enterprises often exceed $20,000 monthly when managing campaigns internally, which only covers media spend and management, not the massive upfront capital expenditure for building proprietary tech.
Viant Technology Inc. (DSP) Mitigation via CTV Focus
Viant Technology Inc. (DSP) is actively mitigating the threat from general display and social media substitutes by leaning heavily into Connected TV (CTV). This focus allows Viant Technology Inc. (DSP) to compete in a high-growth segment that is drawing budget away from traditional TV and competing with digital video on social platforms. As of the third quarter of 2025, CTV ad spend reached 46% of Viant Technology Inc. (DSP)'s total ad spend on its platform. This concentration in CTV, which is itself a digital channel, shows Viant Technology Inc. (DSP) is positioning itself within the fastest-growing segment of digital advertising.
The company's success in this area is notable:
- CTV accounted for 46% of total ad spend in Q3 2025.
- Video advertising, including CTV, reached a record 62% of total platform spend in Q3 2025.
- Emerging digital channels (CTV, streaming audio, DOOH) represented approximately 56% of total platform spend in Q3 2025.
Viant Technology Inc. (DSP) - Porter's Five Forces: Threat of new entrants
You're assessing the barriers to entry for a new Demand-Side Platform (DSP) looking to challenge Viant Technology Inc. in late 2025. Honestly, the deck is stacked against them from the jump. The threat of new entrants is best characterized as moderate, primarily because the initial capital outlay required to build a competitive, modern DSP is substantial.
The estimated initial DSP development cost alone acts as a significant hurdle, reportedly falling in the range of $25-50 million. That's a serious chunk of change before you even onboard your first advertiser. Beyond the pure development cost, new players must immediately contend with the entrenched network effect Viant Technology Inc. has cultivated.
This network effect is visible in their established relationships and the sheer volume of media they transact. For instance, Viant Technology Inc. reported that Connected TV (CTV) ad spend reached a record high, accounting for approximately 45% of the total ad spend on their platform as of the second quarter of 2025. Furthermore, Viant Technology Inc. has built a growth pipeline exceeding $250 million in potential annualized ad spend opportunities with major U.S. advertisers, demonstrating the scale of existing demand they command.
New entrants also face steep technological moats built by Viant Technology Inc. specifically around identity resolution in a privacy-centric world. Viant Technology Inc.'s proprietary identity solutions, namely Household ID and IRIS\_ID, create a distinct technological barrier that new platforms must replicate or bypass to offer comparable omnichannel reach.
The regulatory landscape adds another layer of non-trivial expense. While Viant Technology Inc. states it is generally not subject to GDPR due to its operational focus, adherence to U.S. privacy laws like the CCPA/CPRA still demands significant investment. For context, the average cost of GDPR compliance for mid-to-large companies was estimated at $1.3 million annually. For CCPA compliance, initial costs for businesses can range from $50,000 for very small operations up to $2 million for larger entities. These compliance costs represent an unavoidable, high fixed-cost barrier to entry.
Finally, the operational efficiency driven by Viant Technology Inc.'s AI suite presents a competitive challenge that is hard to match quickly. New entrants struggle to compete on speed and optimization against Viant Technology Inc.'s reported 85% ad spend automation via ViantAI. This level of automation allows Viant Technology Inc. to execute and optimize media plans in seconds, as demonstrated when ViantAI helped a grocery brand allocate a $5M budget across channels almost instantly.
Here's a quick look at the scale Viant Technology Inc. is operating at, which new entrants must overcome:
- Revenue for Q2 2025 was $77.853 million.
- Contribution ex-TAC for Q2 2025 was $48.372 million.
- Adjusted EBITDA for Q2 2025 was $11.283 million.
- CTV spend accounted for 45% of total ad spend in Q2 2025.
- Cash and cash equivalents as of June 30, 2025, totaled $172.816 million.
The technological sophistication required to compete effectively is best summarized by the capabilities Viant Technology Inc. is deploying:
| Viant Technology Inc. Solution | Key Metric/Feature | Latest Reported Figure (2025) |
|---|---|---|
| ViantAI | Time to develop a media plan | Seconds |
| CTV Ad Spend Share | Percentage of total platform spend | Approximately 45% |
| Growth Pipeline | Potential annualized ad spend opportunities | Over $250 million |
| Proprietary Identity | Solutions in use | Household ID and IRIS_ID |
To be fair, the sheer investment in proprietary tech like IRIS\_ID, which leverages AI-driven contextual metadata, means a new entrant needs not just capital, but a parallel, deep investment in data science and privacy-compliant identity resolution that has already been made by Viant Technology Inc.. The combination of required capital, established network effects, and proprietary technology makes the threat of new entrants a persistent, though not insurmountable, challenge for Viant Technology Inc.
Finance: review the capital expenditure budget for Q4 2025 against the required DSP build-out cost estimate.
Disclaimer
All information, articles, and product details provided on this website are for general informational and educational purposes only. We do not claim any ownership over, nor do we intend to infringe upon, any trademarks, copyrights, logos, brand names, or other intellectual property mentioned or depicted on this site. Such intellectual property remains the property of its respective owners, and any references here are made solely for identification or informational purposes, without implying any affiliation, endorsement, or partnership.
We make no representations or warranties, express or implied, regarding the accuracy, completeness, or suitability of any content or products presented. Nothing on this website should be construed as legal, tax, investment, financial, medical, or other professional advice. In addition, no part of this site—including articles or product references—constitutes a solicitation, recommendation, endorsement, advertisement, or offer to buy or sell any securities, franchises, or other financial instruments, particularly in jurisdictions where such activity would be unlawful.
All content is of a general nature and may not address the specific circumstances of any individual or entity. It is not a substitute for professional advice or services. Any actions you take based on the information provided here are strictly at your own risk. You accept full responsibility for any decisions or outcomes arising from your use of this website and agree to release us from any liability in connection with your use of, or reliance upon, the content or products found herein.